Our Work
DataMade specializes in creating data-driven processes and tools for transparency and action. See how we’ve put data to work with our partners.
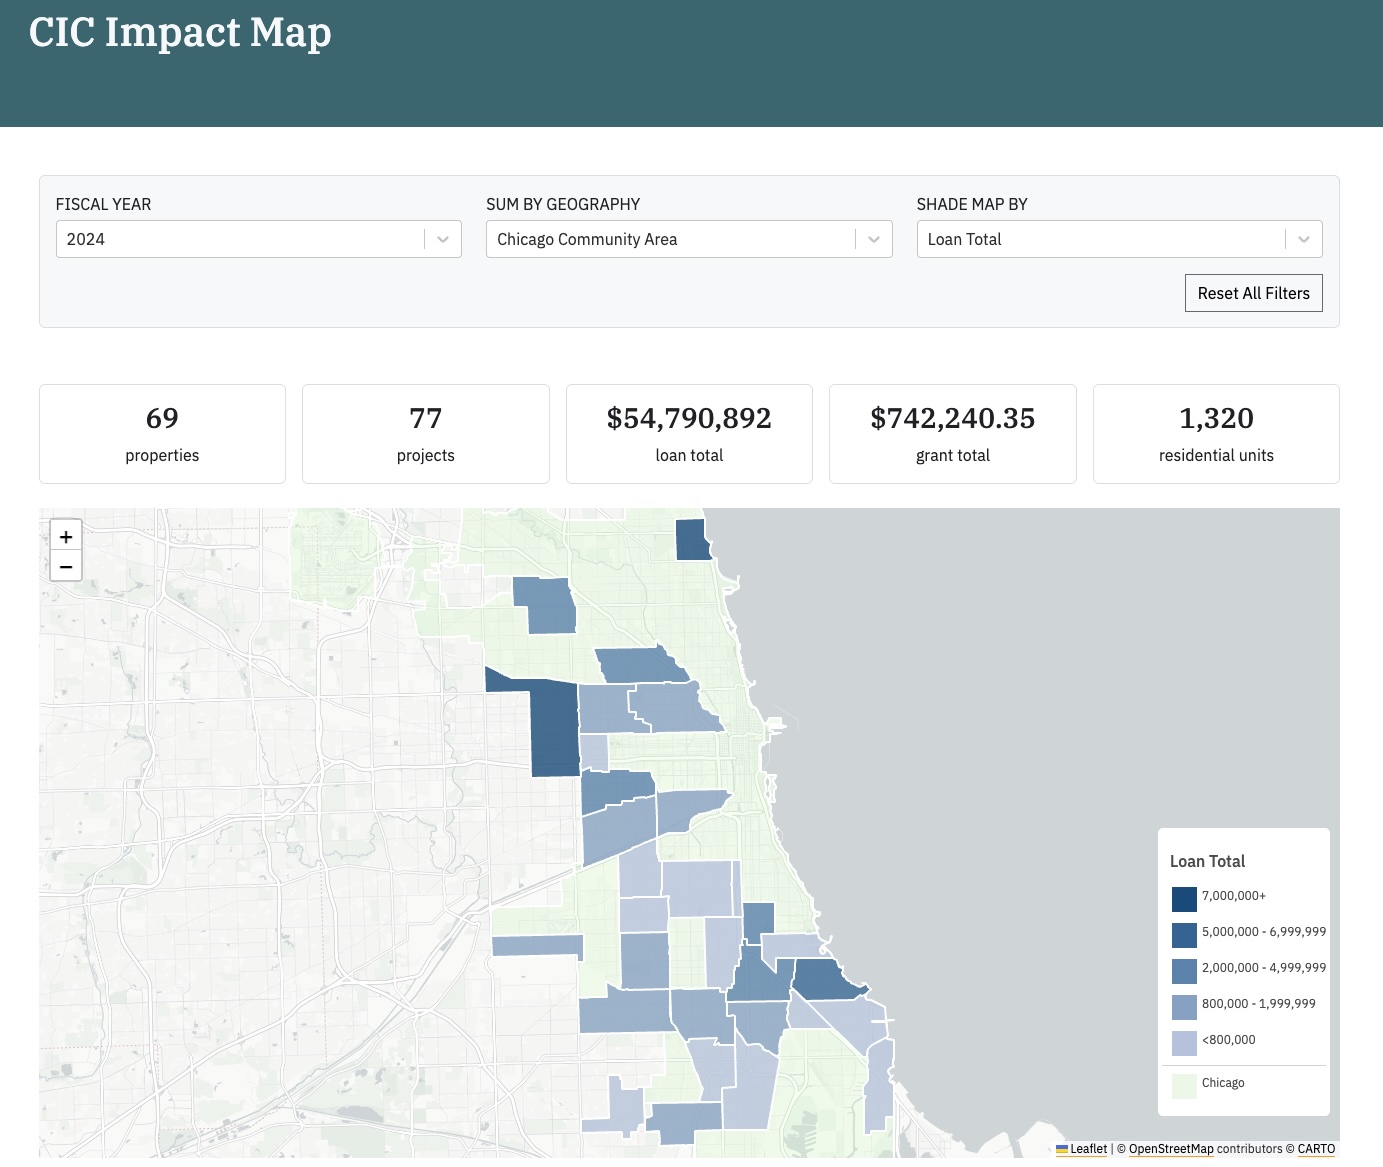
Community Investment Corporation's Lending Impact Map
Partnership with Community Investment Corporation
An interactive map showing the impact of Community Investment Corporation’s lending for affordable rental housing in Chicagoland.
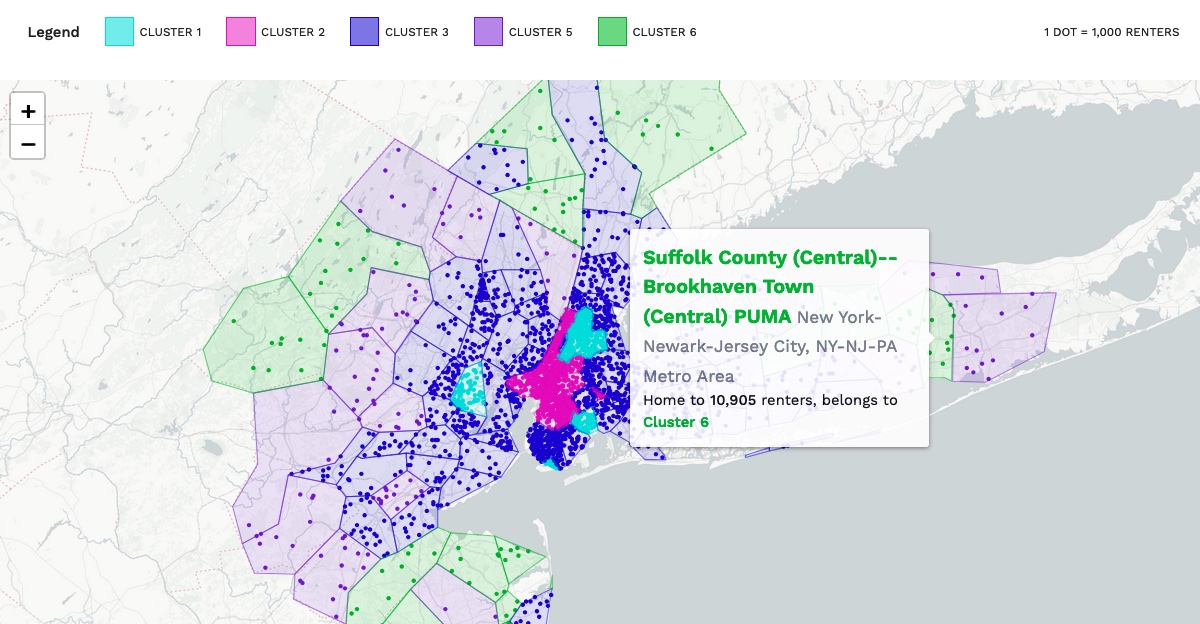
Preserving Naturally Occurring Affordable Housing
Partnership with The Preservation Compact, DePaul Institute for Housing Studies
A mapping tool designed to facilitate evidence-based decision-making in preservation strategies for affordable multifamily rental housing.
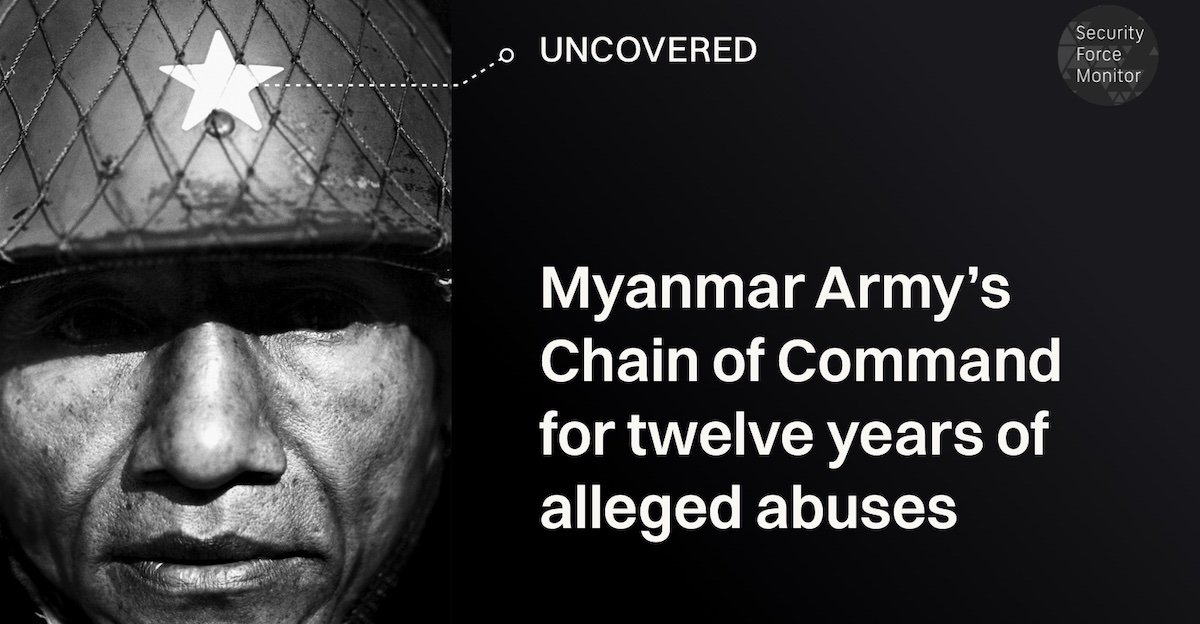
Under Whose Command? Human rights abuses under Myanmar's military rule
Partnership with Columbia Law School Human Rights Institute
A powerful, mobile optimized data visualization and story detailing institutionalised human rights abuses by Myanmar’s military.
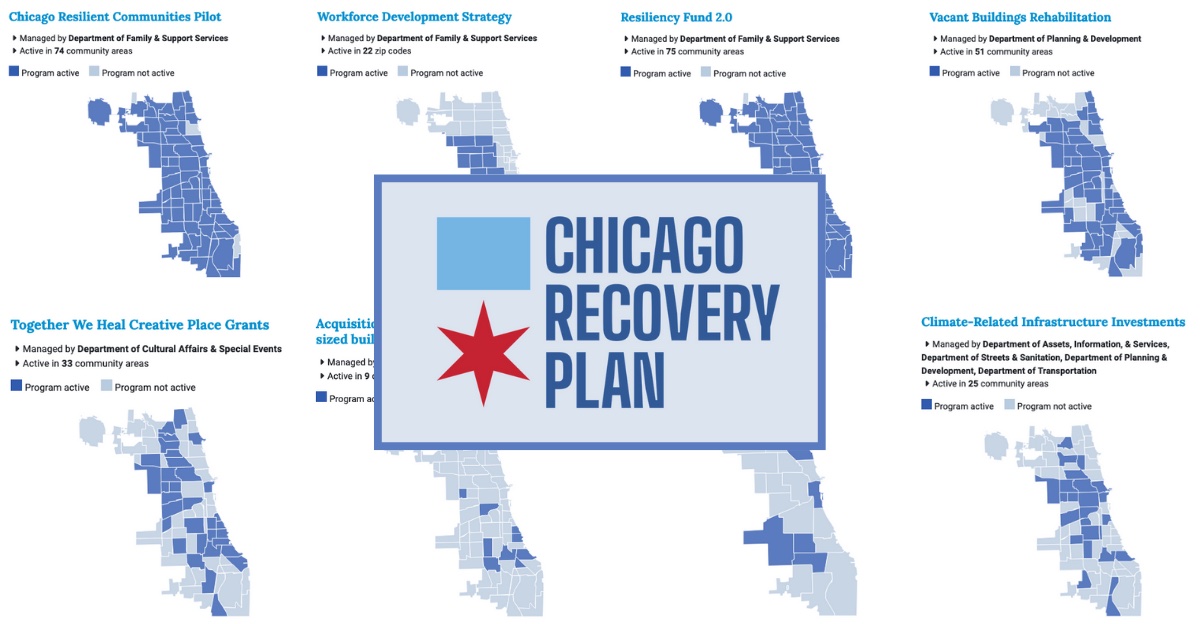
Partnership with City of Chicago
Transparency site showing the impact of over 30 programs under the Chicago Recovery Plan and what neighborhoods they are active in.
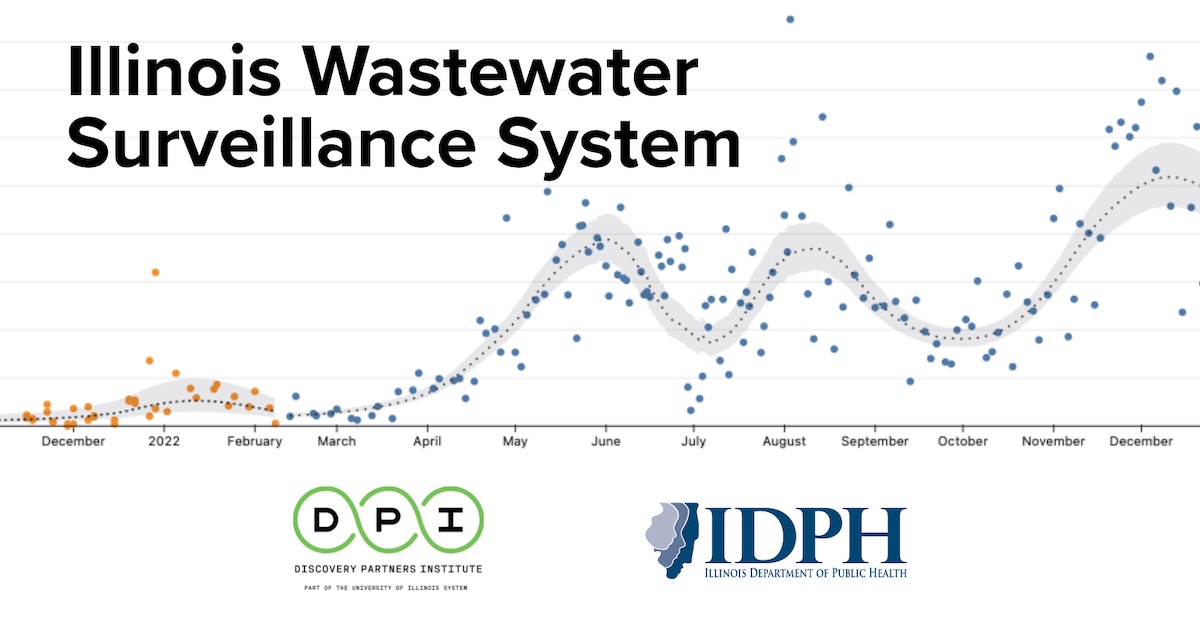
Illinois Wastewater Surveillance System
Partnership with Discovery Partners Institute and Illinois Department of Public Health
Provides series of COVID-19 measurements from wastewater for 75 sites across the state of Illinois.
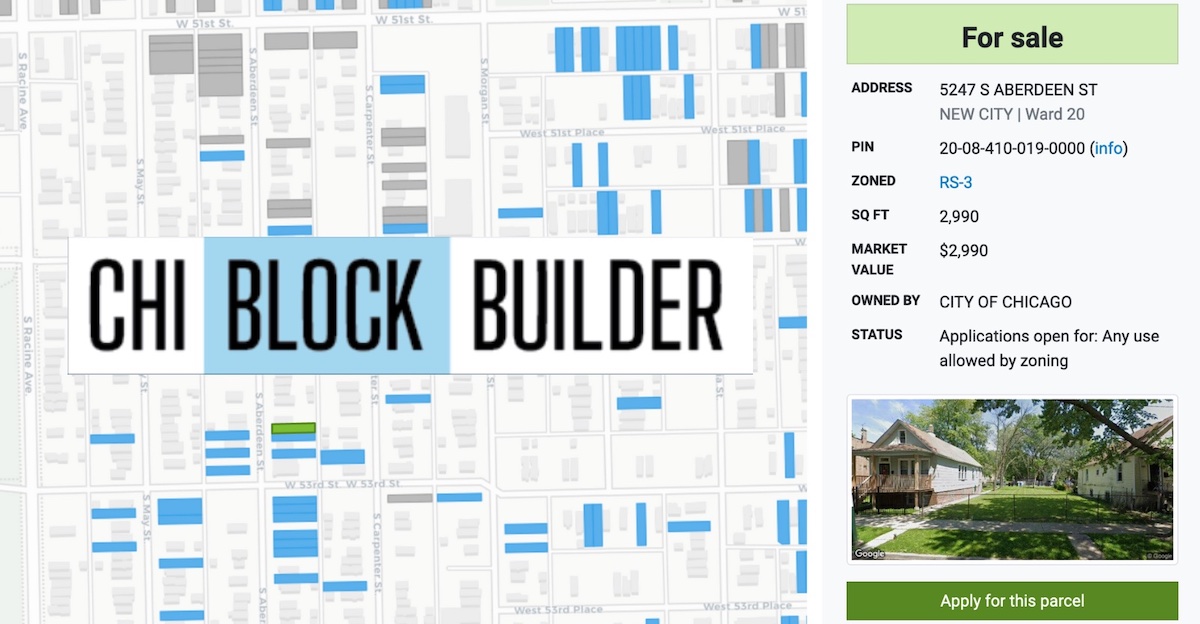
Partnership with City of Chicago - Department of Planning and Development
Browse all City-owned vacant surplus property in Chicago and apply to buy it.

Understanding Employment Quality in Illinois
Partnership with Project for Middle Class Renewal, School of Labor and Employment Relations at University of Illinois at Urbana-Champaign
An interactive visualization that shows how different job features influence employment quality based on surveys of 3,500 workers across Illinois.
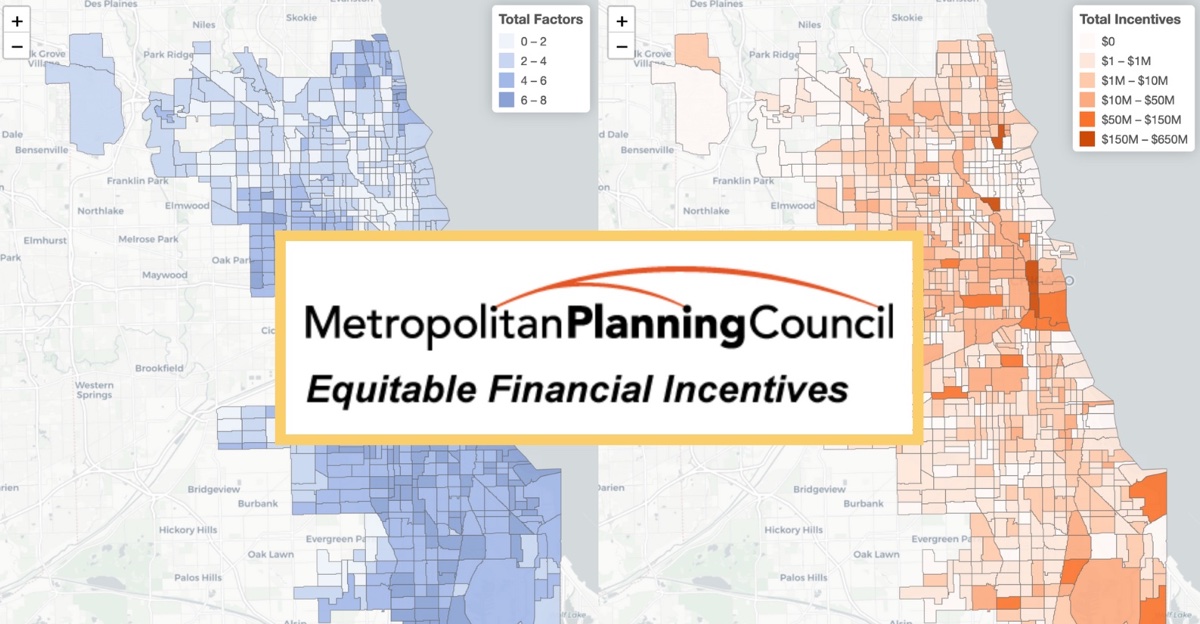
Equitable Financial Incentives
Partnership with Metropolitan Planning Council (MPC)
View incentive program spending in Chicago and recommendations to make them more equitable.
Partnership for Land Use Insights
Partnership with University of California Berkeley
We visualized how local governments regulate land use to provide the actionable insights leaders need to achieve their climate, equity, affordability goals
National Wastewater Surveillance System Schema
Partnership with California Department of Public Health
A structured schema to help validate submissions of COVID test results in wastewater samples at scale.
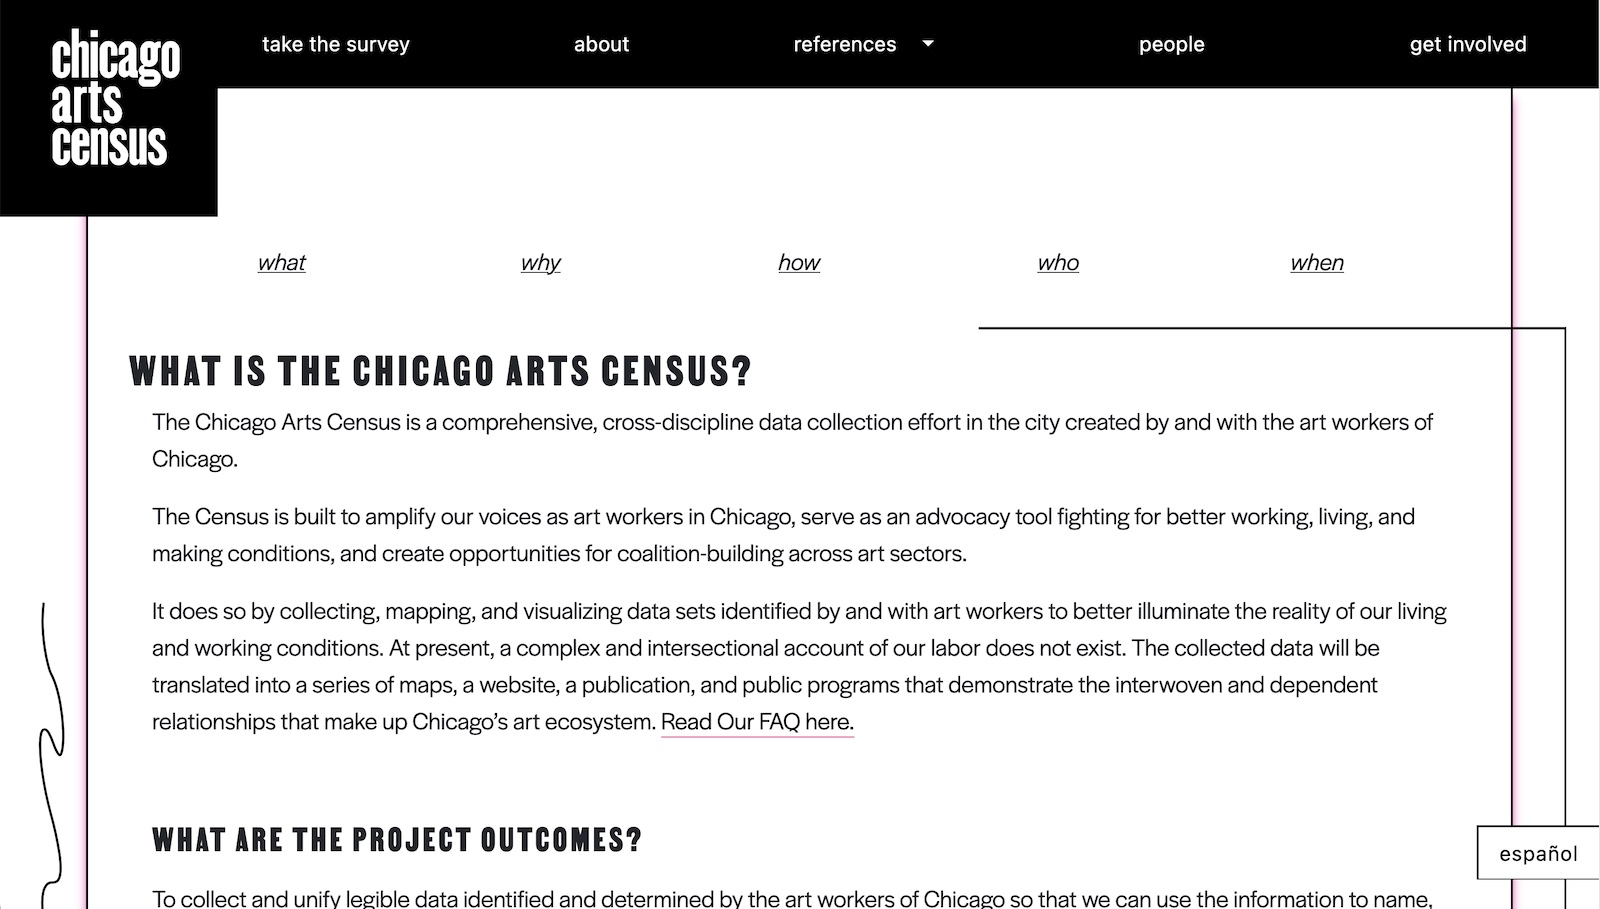
Partnership with Artists' Cooperative Residency & Exhibitions (ACRE)
We built and helped design a web portal to survey art workers in Chicago
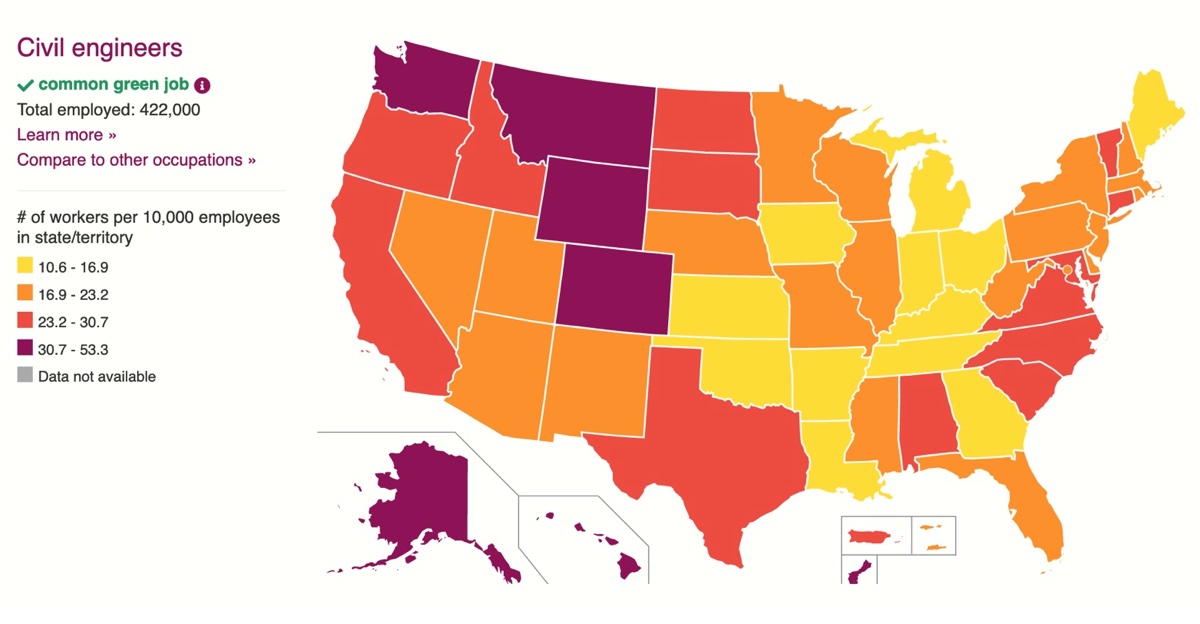
Who Benefits from Climate Ambition?
Partnership with Data for Progress
Explore and compare nearly 600 occupations in the US, including over 100 common green jobs.
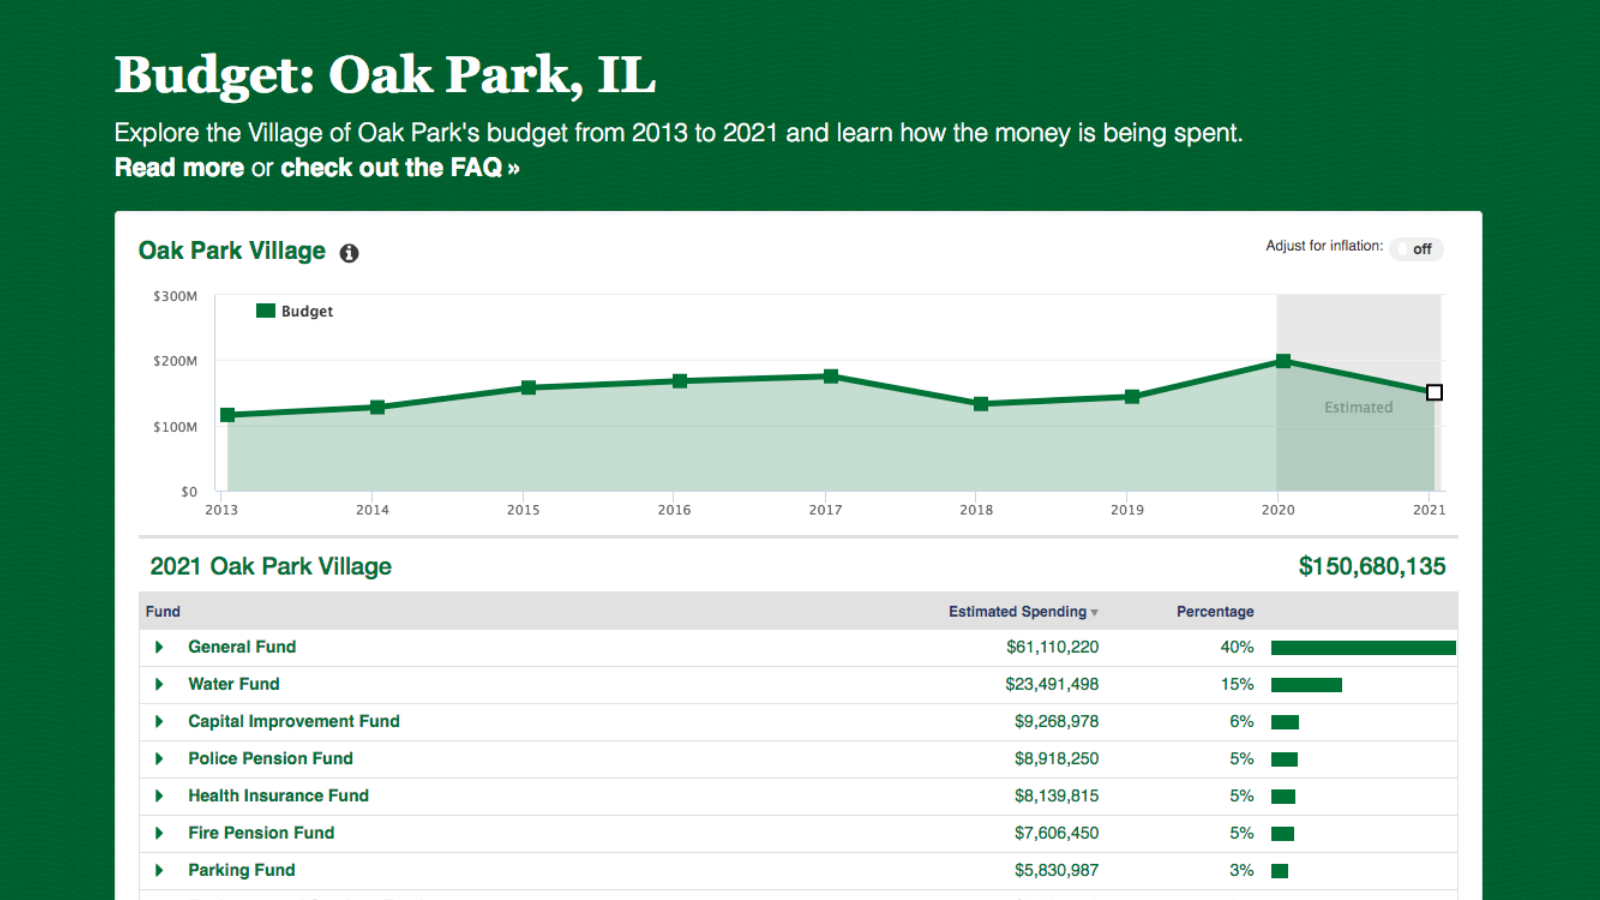
Partnership with Pro Bono
An explorable budget for the Village of Oak Park to make government more transparent and accountable.
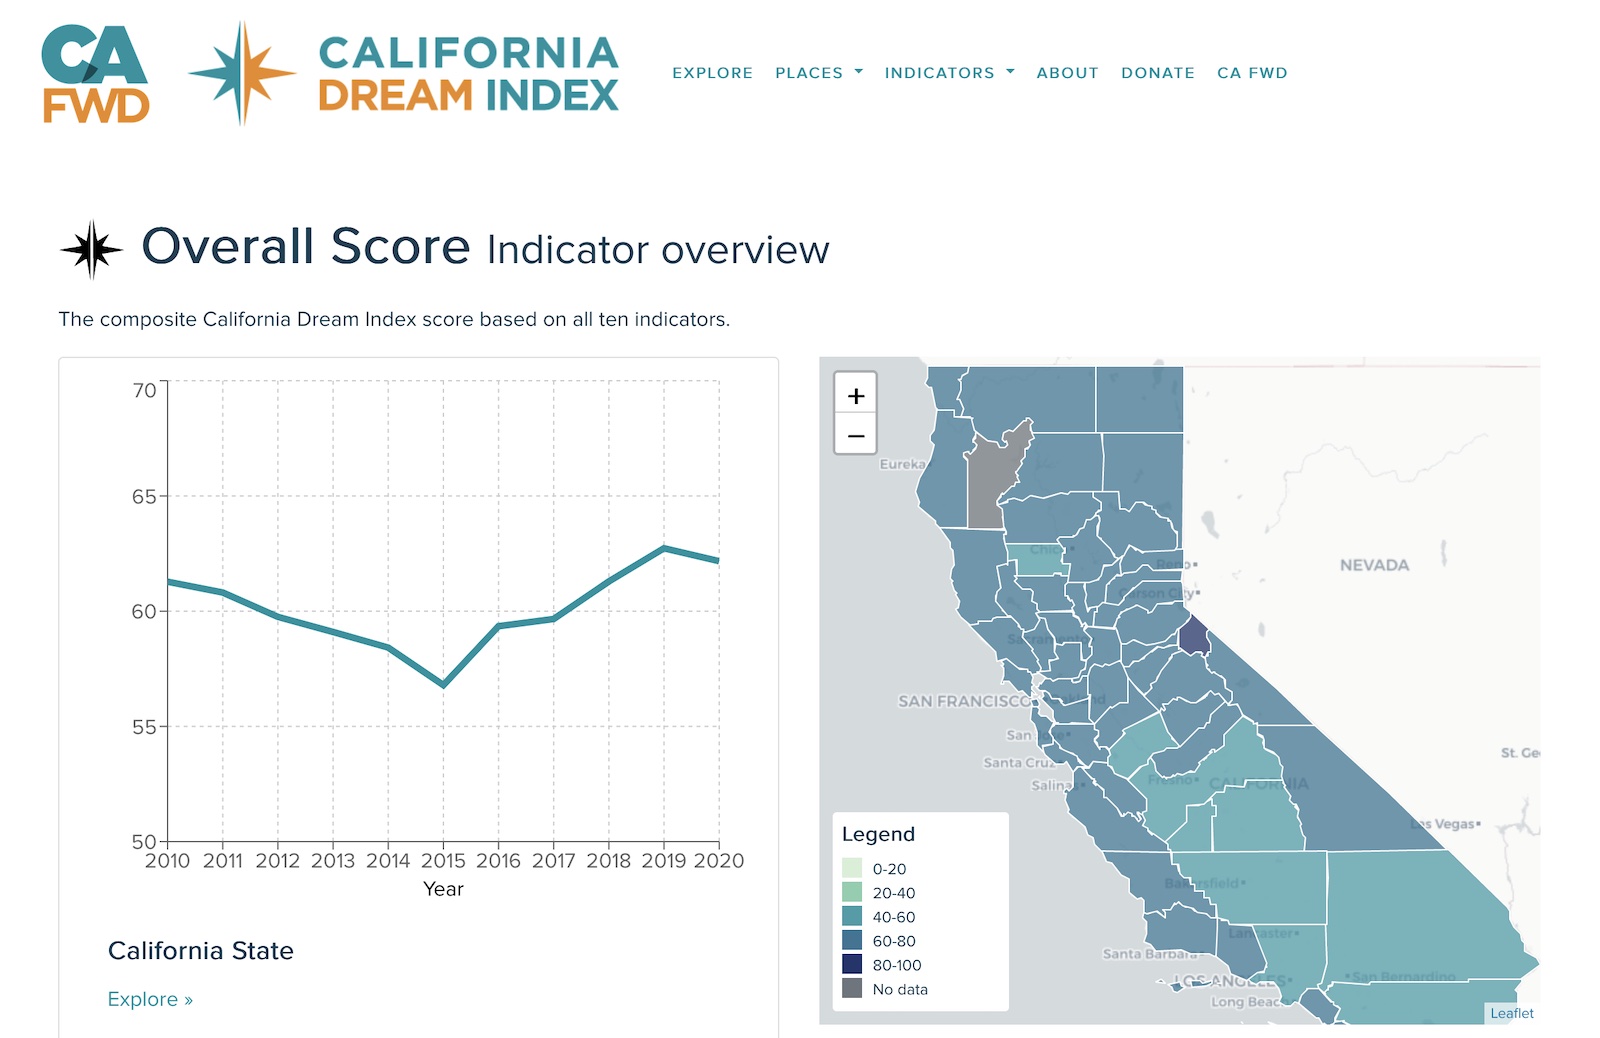
Partnership with California Forward
We built a socioeconomic mobility measurement portal designed to help policy and decision-makers learn more about the level of access that Californians have to education, health, jobs, and opportunities
CPS Local School Councils - Election Guide
Partnership with Chalkbeat Chicago
We partnered with Chalkbeat Chicago to provide actionable information on voting and running for local school councils.
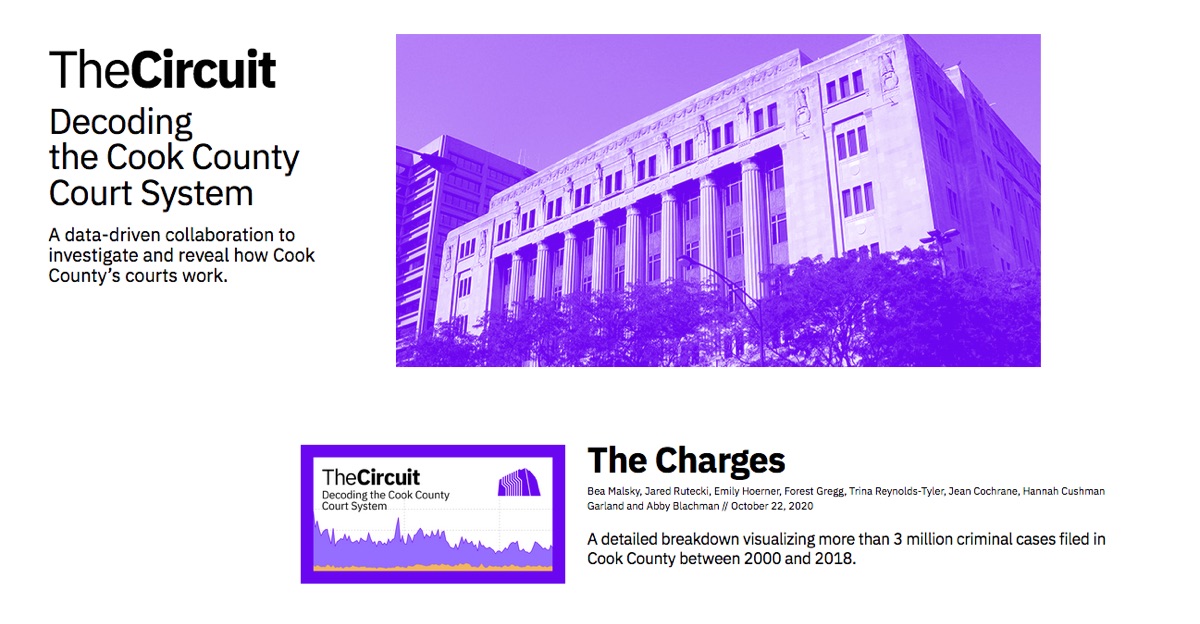
Partnership with BGA, The Chicago Reporter, Injustice Watch
A data-driven collaboration to investigate and reveal how Cook County’s courts work using 3 million filed criminal cases.
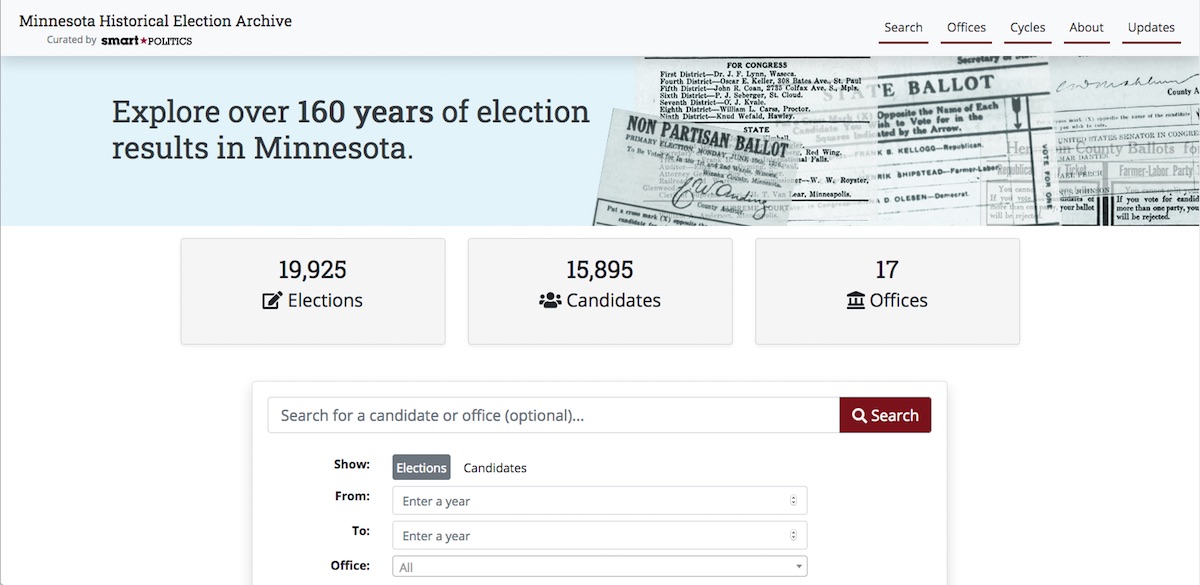
Minnesota Historical Election Archive
Partnership with Smart Politics and University of Minnesota Libraries Publishing
A powerful search interface for the most complete archive of historical Minnesota election results.
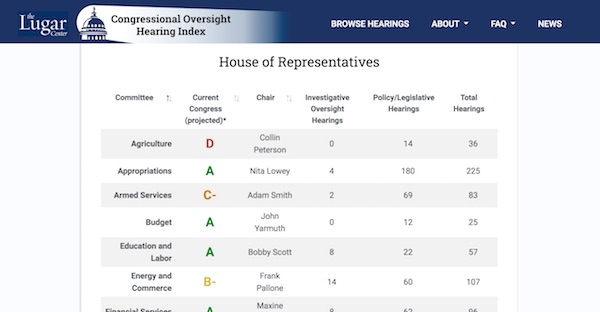
Congressional Oversight Hearing Index
Partnership with The Lugar Center
A database of congressional hearings to provide measurable insight into Congress’s commitment to oversight.
Illinois Public Pensions Database
Partnership with Illinois Answers Project
Explore nearly a decade’s worth of system metadata and millions of beneficiary records from the largest public-sector pension funds in Illinois.
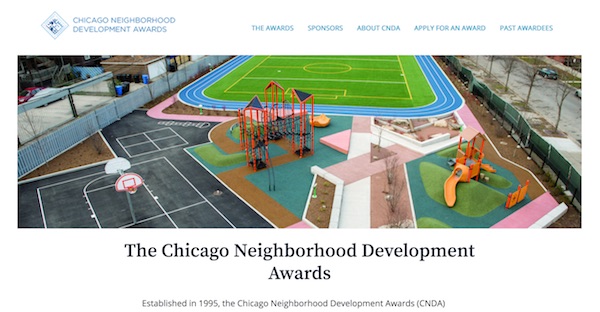
The Chicago Neighborhood Development Awards Website
Partnership with LISC Chicago
An online application and awardee showcase for development projects in Chicago to recognize the essential role that both non-profit and for-profit developers play in building communities.
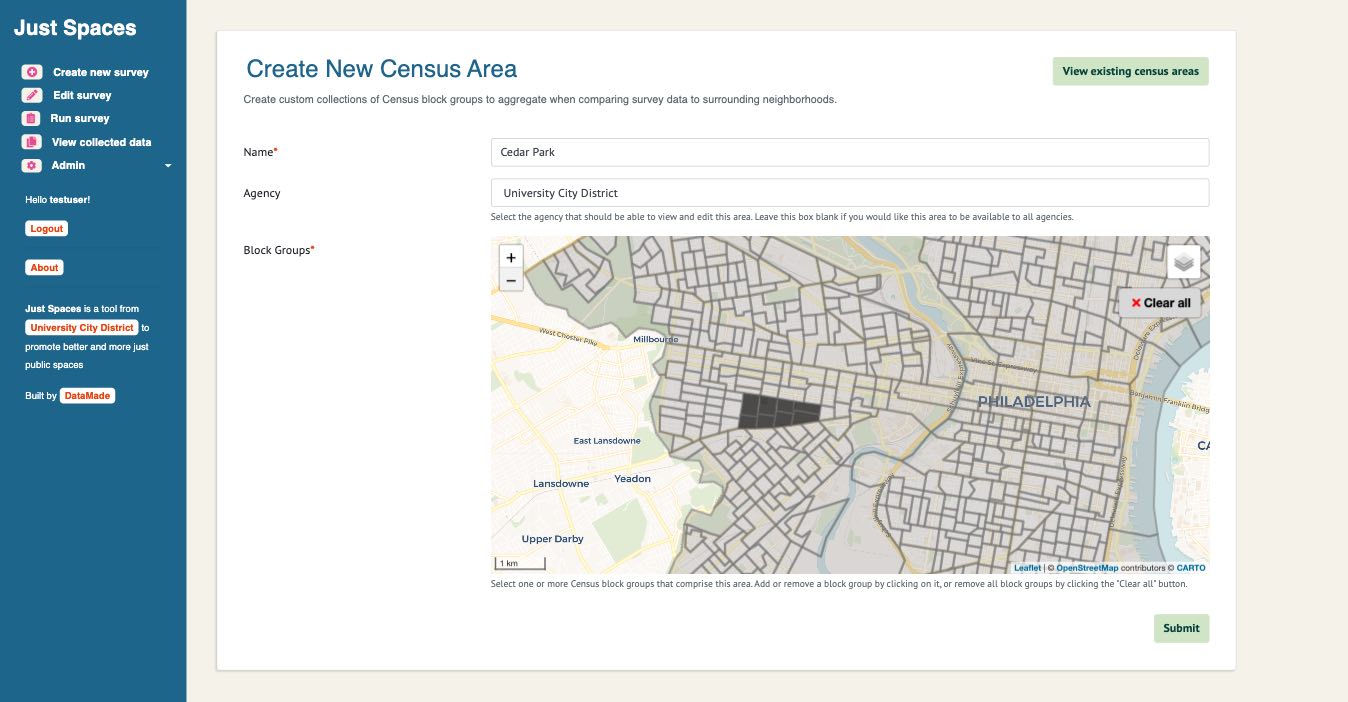
Partnership with University City District
A mobile-friendly web app for collecting and visualizing data about the justness and inclusivity of public spaces.
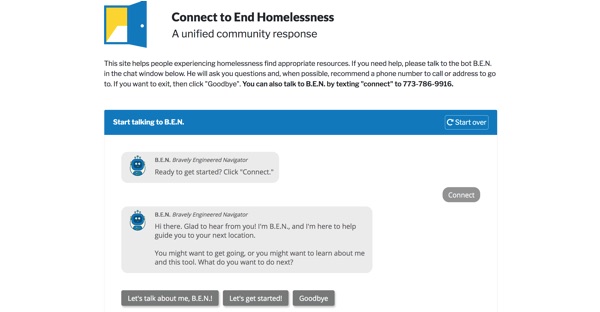
Text to Connect to End Homelessness
Partnership with Corporation for Supportive Housing (CSH)
A texting platform designed to help more people experiencing homelessness find pathways to housing and services.
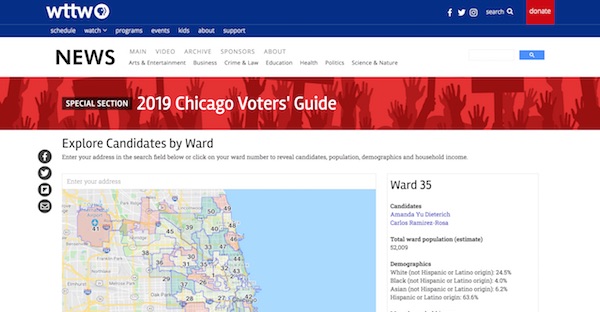
WTTW - 2019 Election Ward Demographics
Partnership with WTTW Chicago Tonight
We aggregated and combined data on population, demographics and median household income by Ward for Chicago Tonight’s coverage of the 2019 Chicago municipal election.
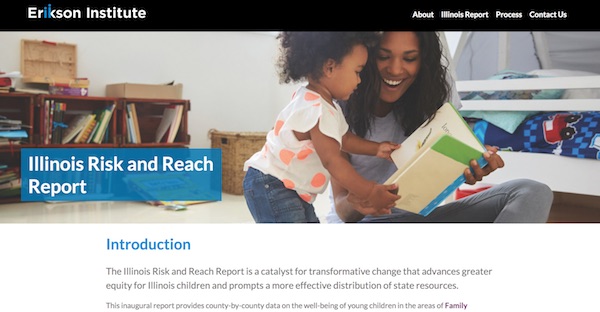
Illinois Risk and Reach Report Website
Partnership with Erikson Institute
A comprehensive report for the State of Illinois showing county-by-county data on the well-being of young children in the areas of Family Stability, Health, and Early Care and Education.
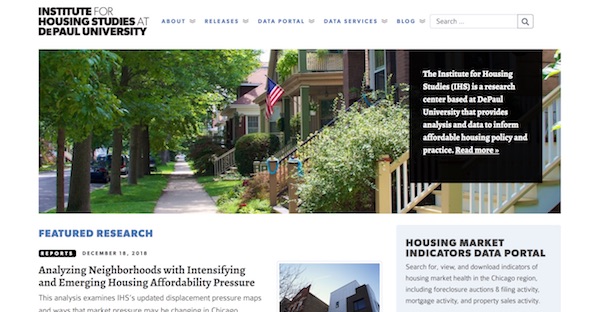
HousingStudies.org - Website Redesign
Partnership with DePaul Institute for Housing Studies
A complete website and data portal redesign to update the interface, reorganize the research, and better showcase IHS’s services and work.
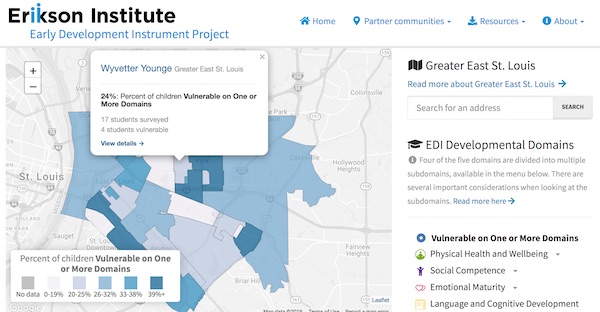
Early Development Instrument Project
Partnership with Erikson Institute
An interactive map for exploring the physical, social, emotional, language and communication development of young children within the context of their community.
Illinois Public Salaries Database
Partnership with Illinois Answers Project
Review, explore and compare compensation for over 500,000 public employees throughout Illinois.
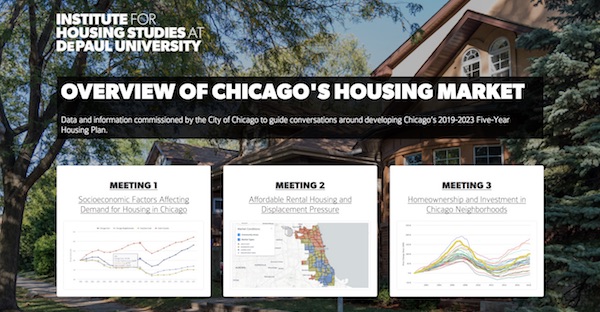
Overview of Chicago's Housing Market
Partnership with Institute for Housing Studies at DePaul University
Charts and tables showing trends in Chicago’s housing demand, demographic and economic shifts and affordable housing to help inform the City of Chicago’s 5 year housing plan.
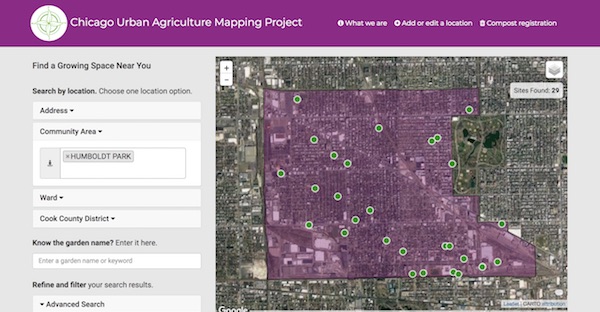
Chicago Urban Agriculture Mapping Project
Partnership with NeighborSpace
A website to collaboratively map and inventory urban agriculture and community gardens in Chicago.
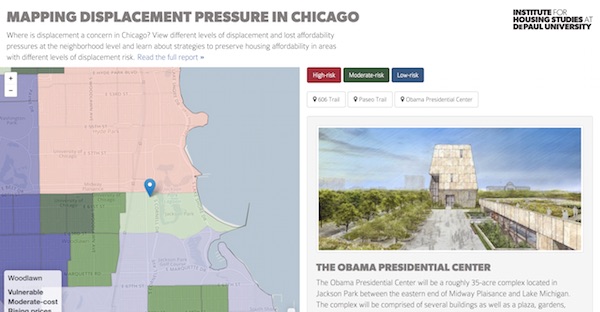
Mapping Displacement Pressure in Chicago
Partnership with Institute for Housing Studies at DePaul University
An interactive map to view different levels of displacement and lost affordability pressures in Chicago and learn about strategies to preserve housing affordability.
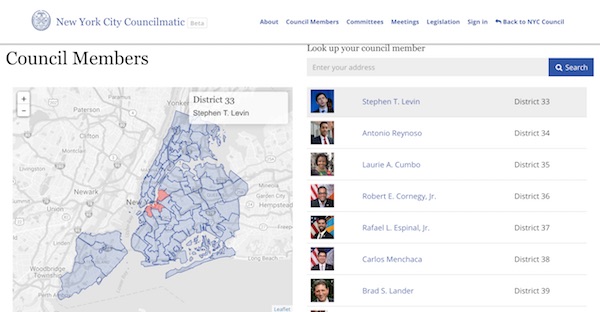
Partnership with New York City Council
An open government tool to help users access, track, and understand the activities of New York City Council.
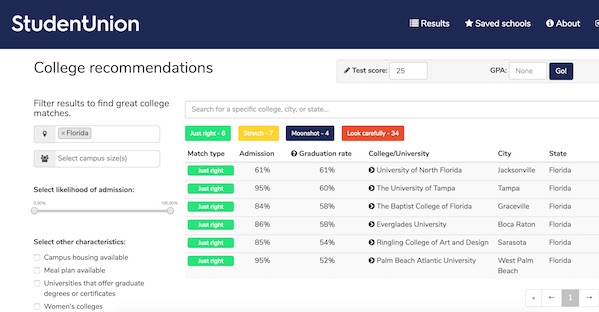
Partnership with Uptake.org
A tool to help match high-school students with their best-fit colleges.
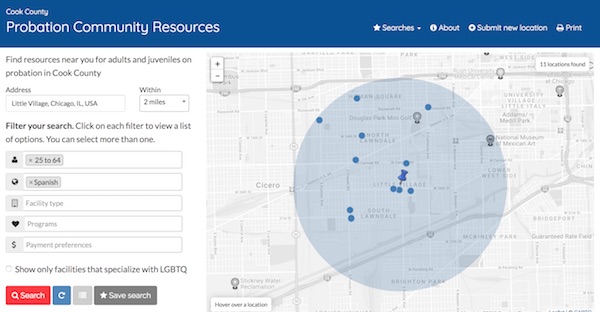
Cook County Probation Community Resources
Partnership with Sargent Shriver National Center on Poverty Law, the Chicago Appleseed Fund for Justice, Health & Medicine Policy Research Group
An interactive map and directory that helps criminal justice personnel refer clients to culturally relevant and geographically specific community-based services throughout Cook County.
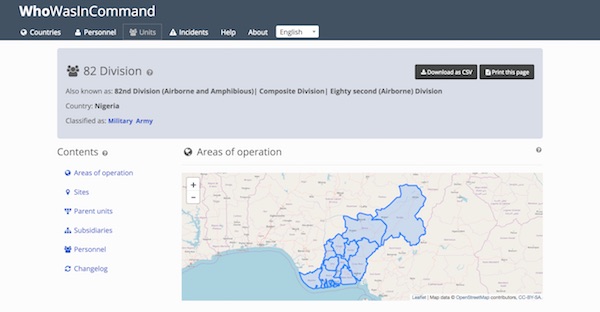
Partnership with Security Force Monitor
A system for compiling public information on security forces to aid journalists, human rights groups and litigators to hold security forces accountable.
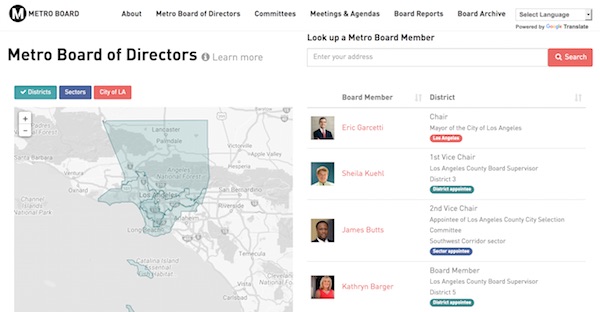
Los Angeles Metro Board Agendas
Partnership with Los Angeles County Metropolitan Transportation Authority
An open government tool for understanding and tracking the activity of the Board Members of the Los Angeles County Metropolitan Transportation Authority.
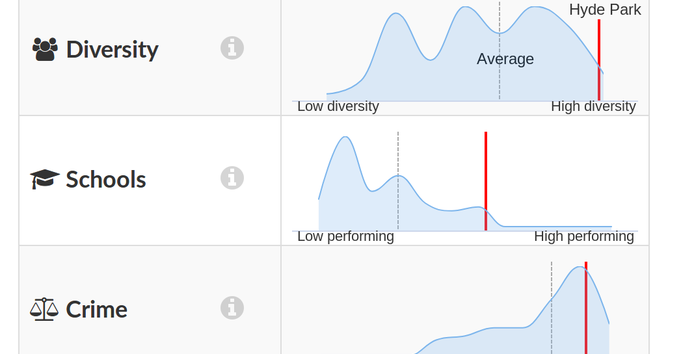
Partnership with Crain's Chicago Business
A tool to score, sort, and filter real estate in Chicagoland neighborhoods based on a variety of statistics.
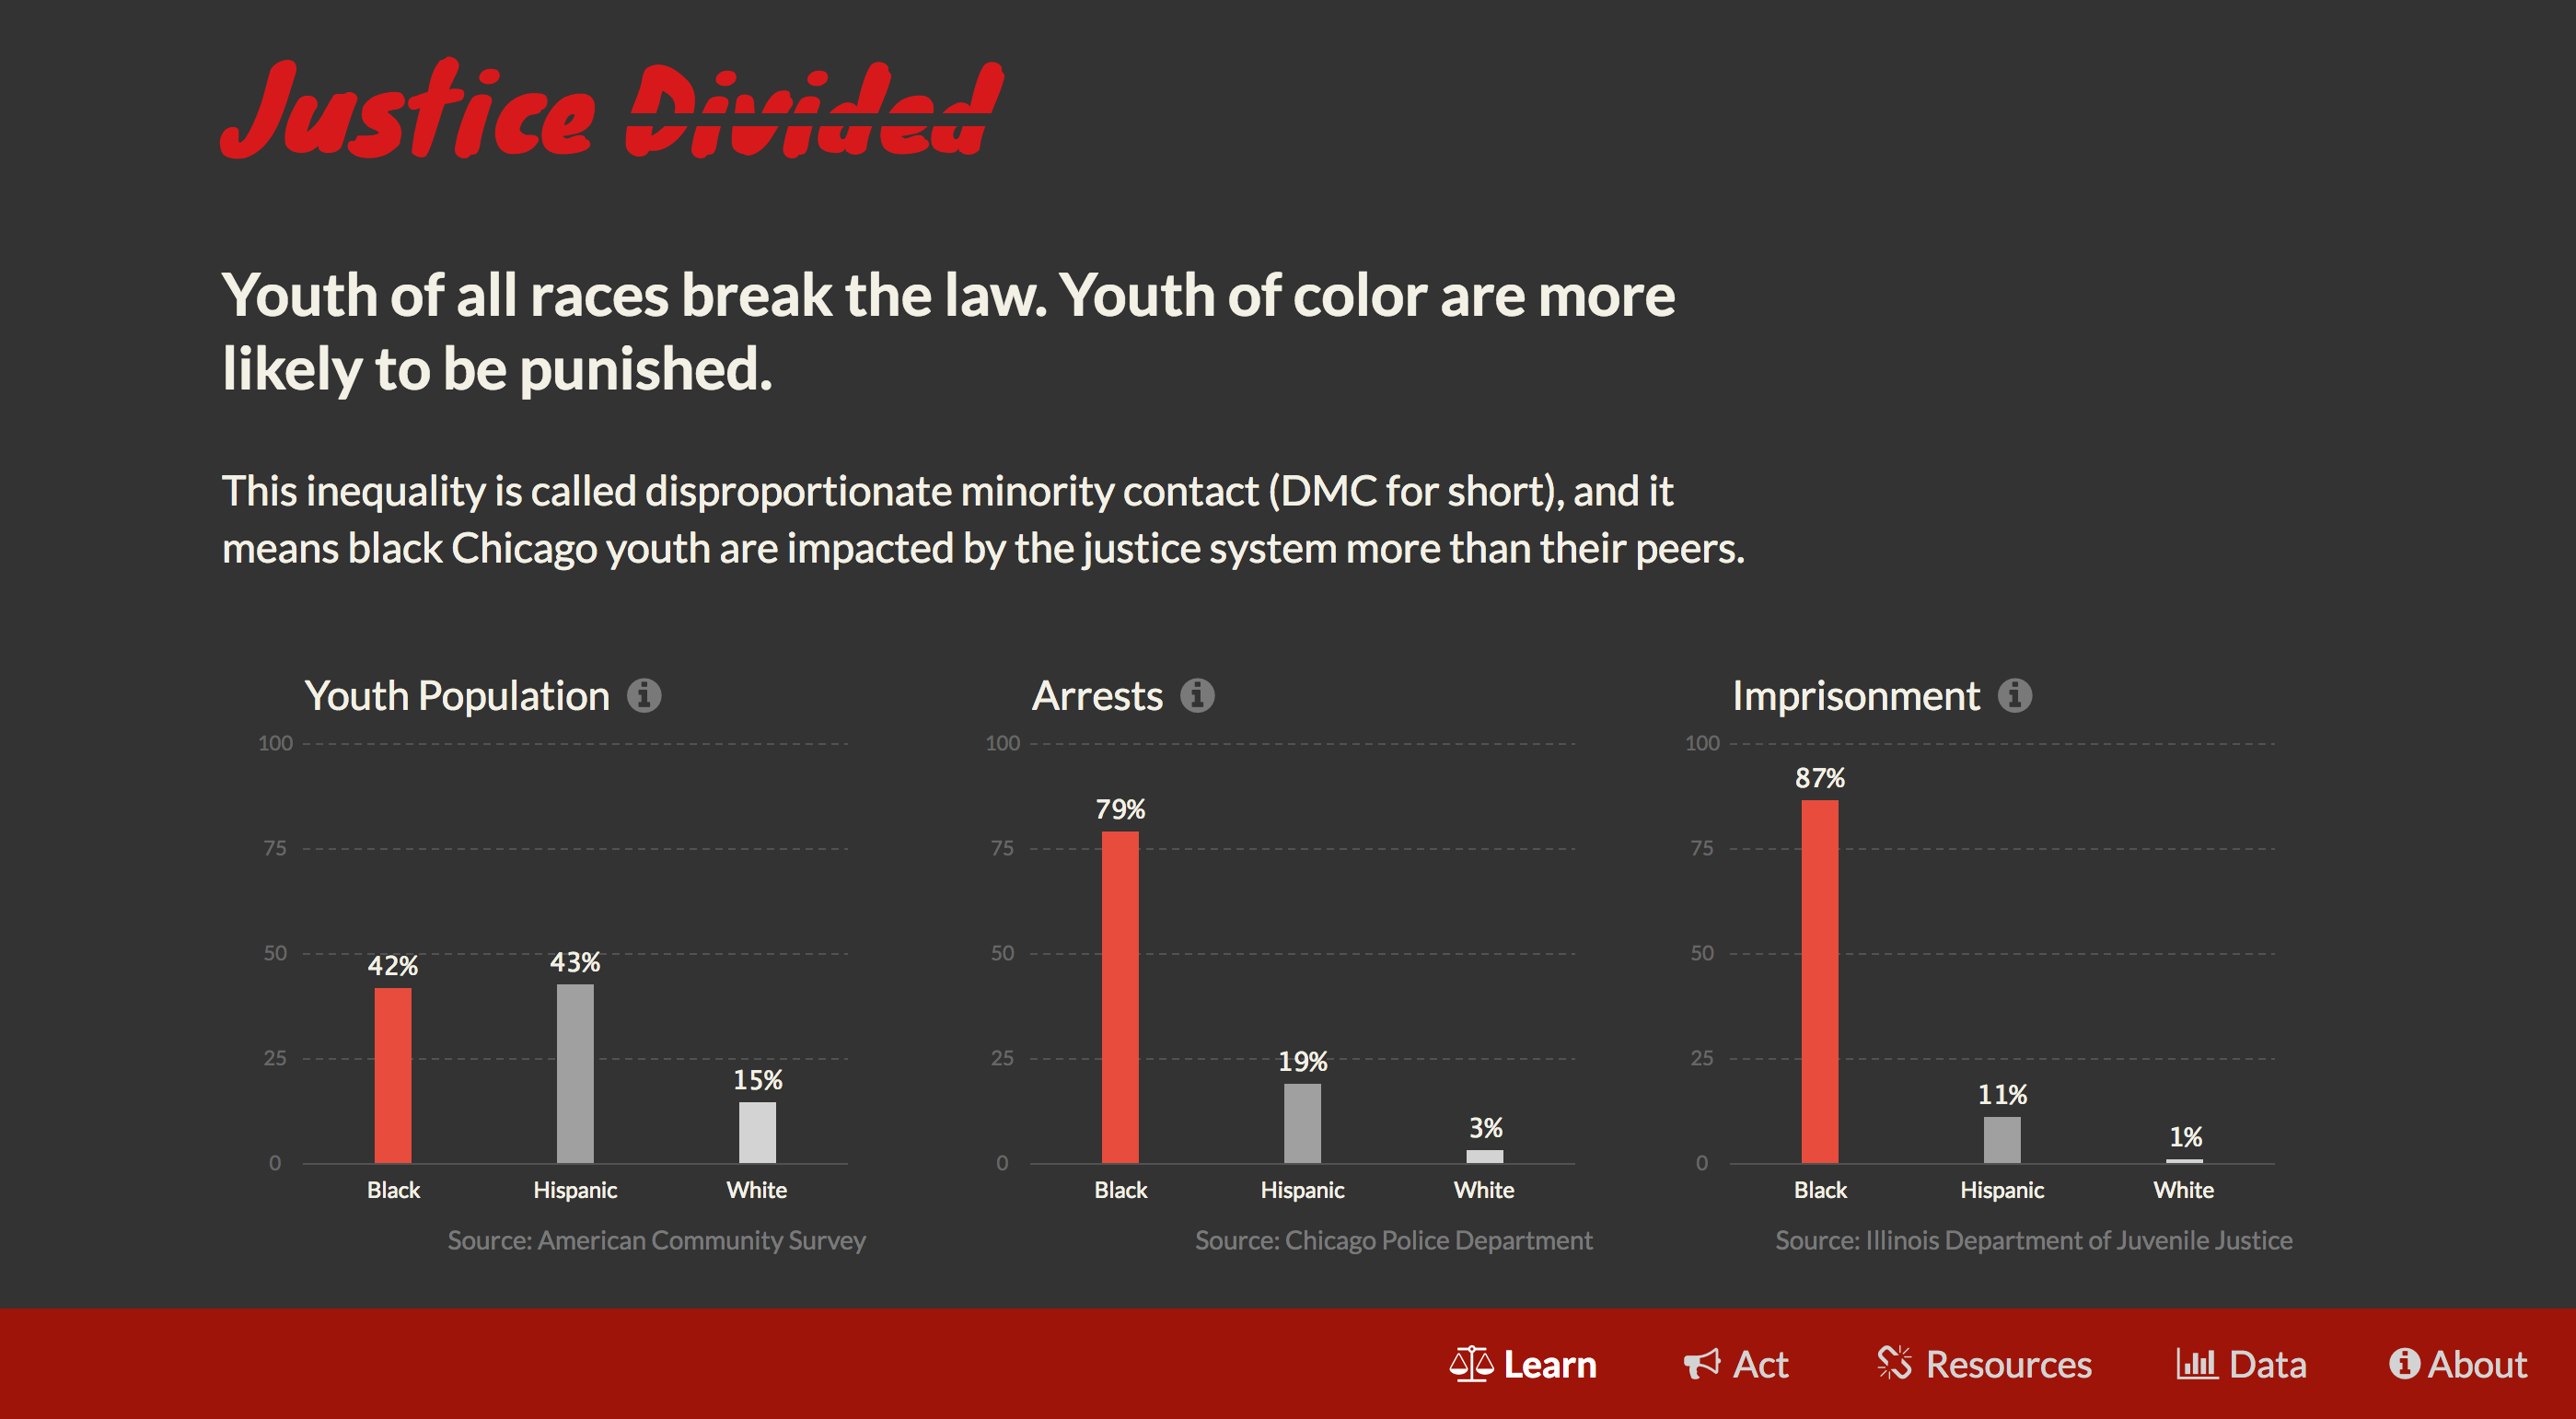
Partnership with Illinois Justice Project, Adler University, Project NIA
An educational tool and data repository for promoting awareness of disproportionate minority contact, or the overrepresentation of black youth in the juvenile justice system.
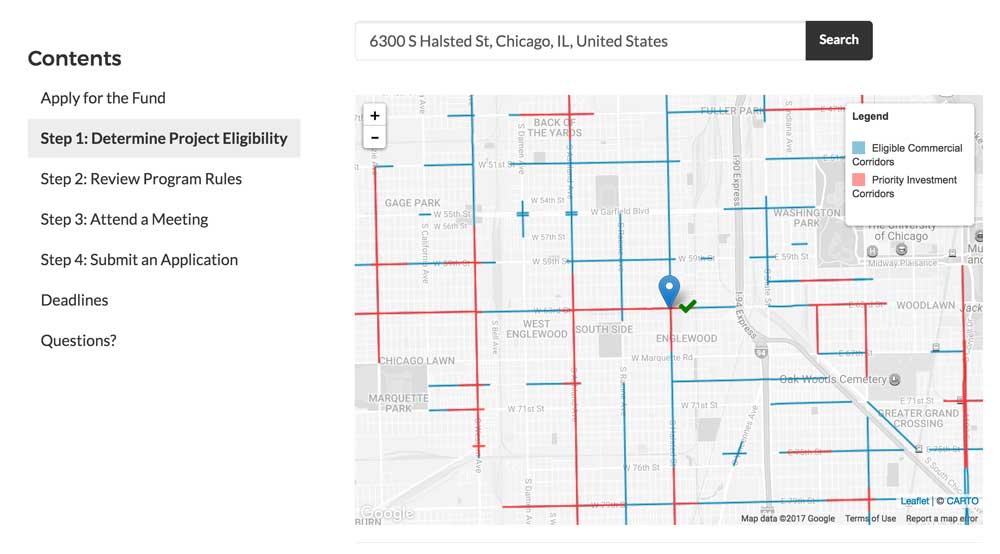
Partnership with SomerCor
A website to help property owners in underserved neighborhoods access block grants for economic development.
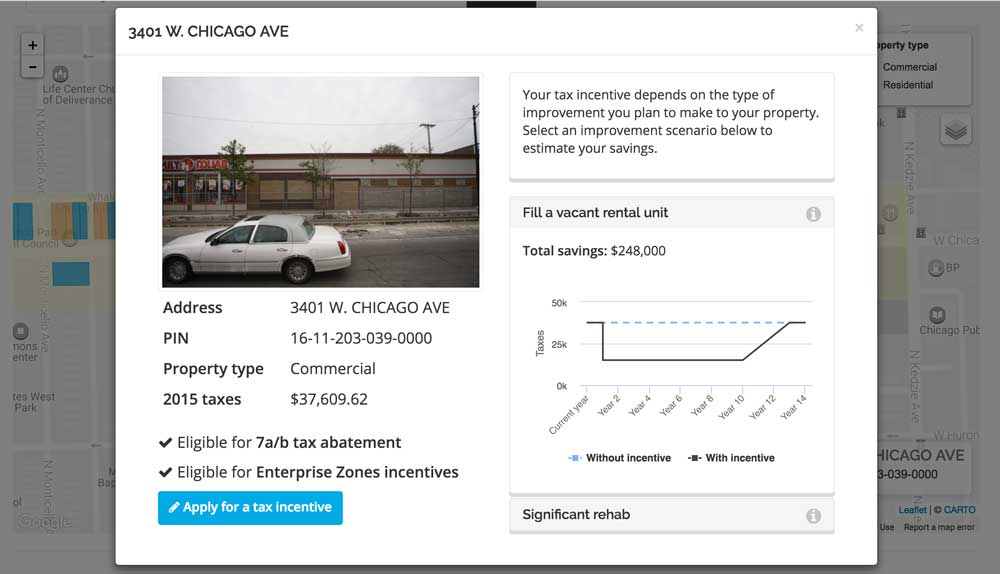
Partnership with SomerCor
A web portal that makes it easy for businesses in low-income neighborhoods to apply for tax breaks — with an interactive map, dynamic charts, and an easy-to-use application form.
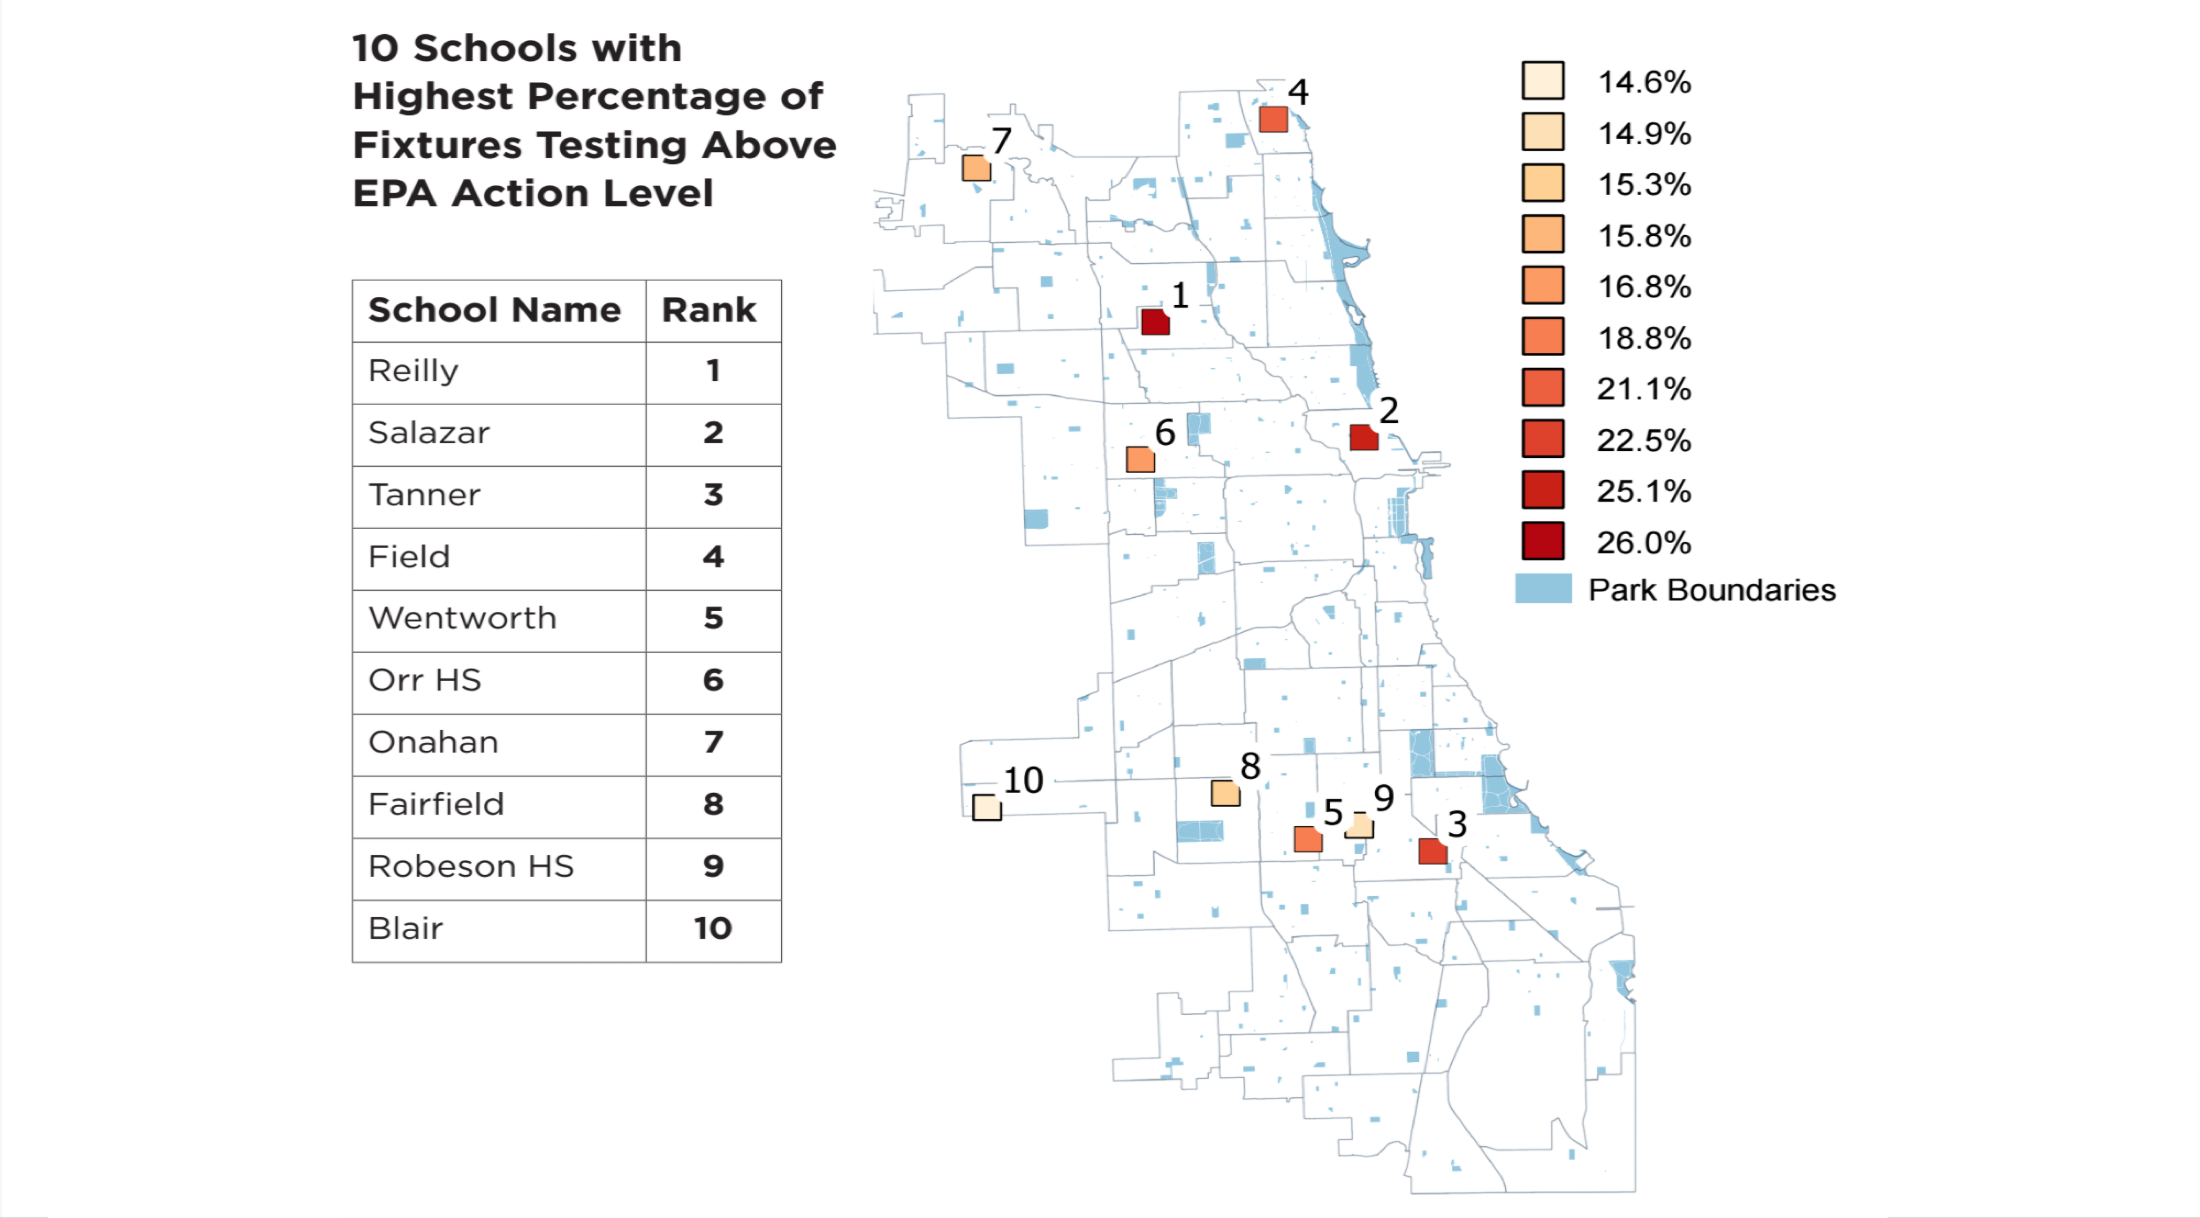
Partnership with City Bureau
Liberation and statistical treatment of data on lead in Chicago’s schools and parks from more than 500 PDFs.
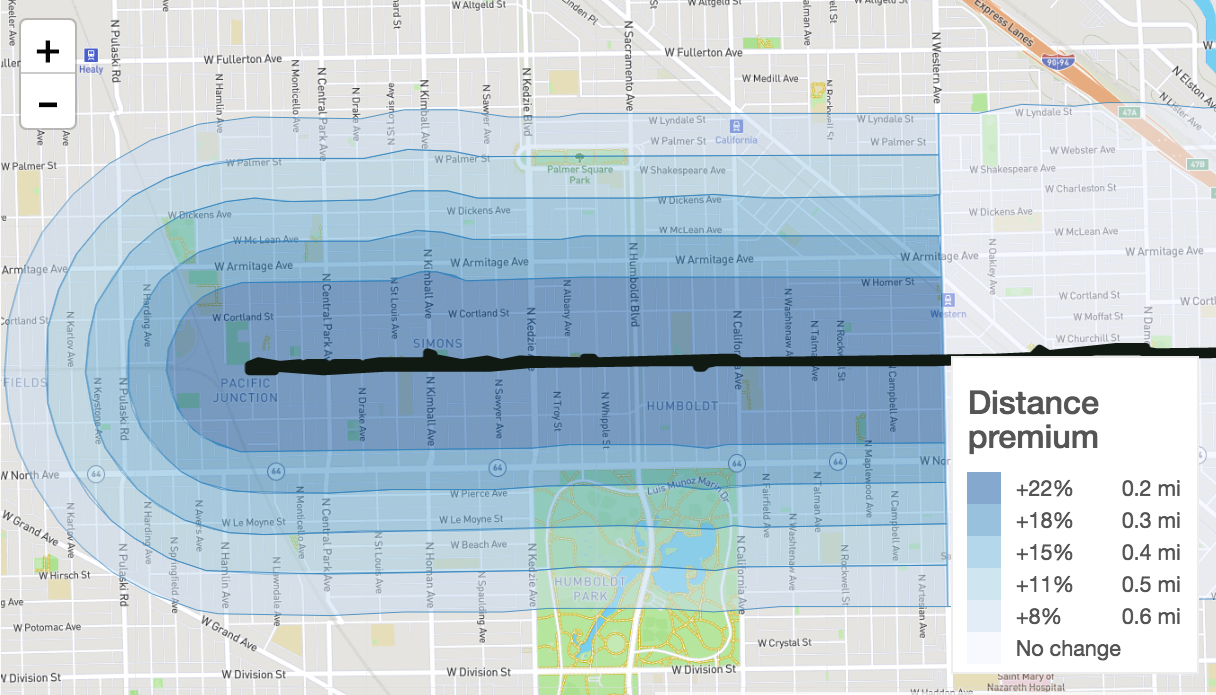
Partnership with Institute for Housing Studies at DePaul University
Interactive maps and charts that measure change in the housing market near Chicago’s 606 linear park.
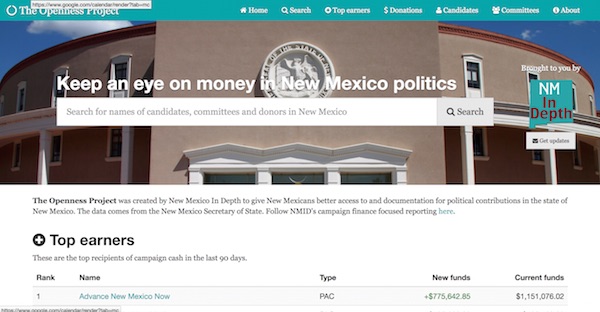
Partnership with New Mexico In Depth
Search and browse all political contributions, expenditures, and candidates in statewide and local New Mexico races.
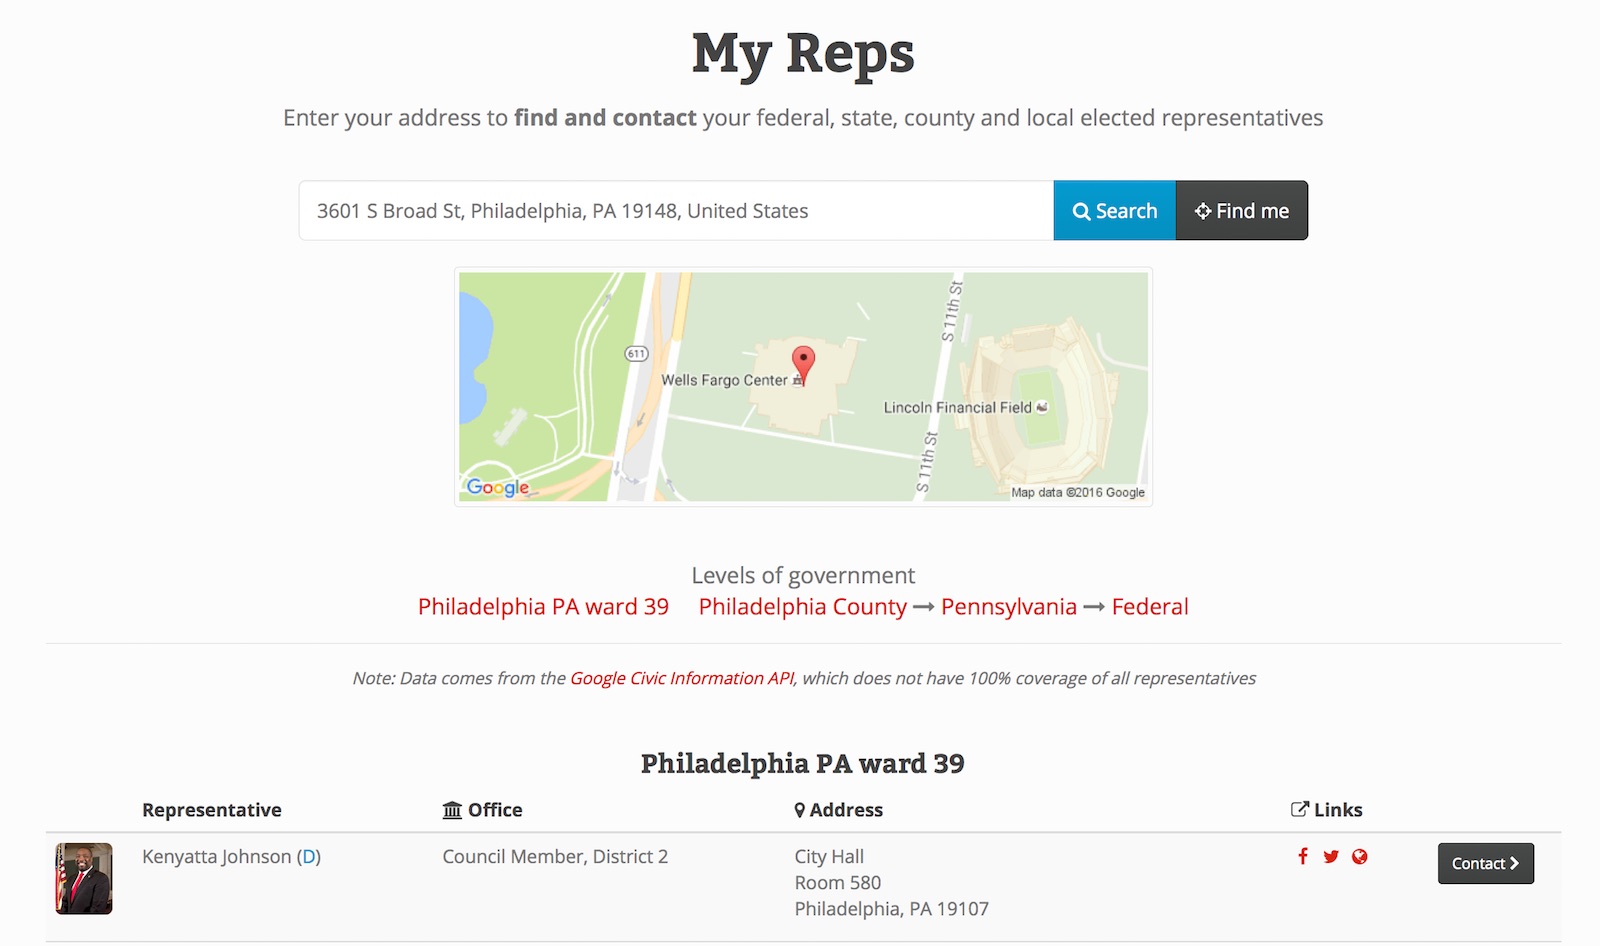
Partnership with Participatory Budgeting Project
Enter your address to find your local elected representatives and then tell them to support participatory budgeting!
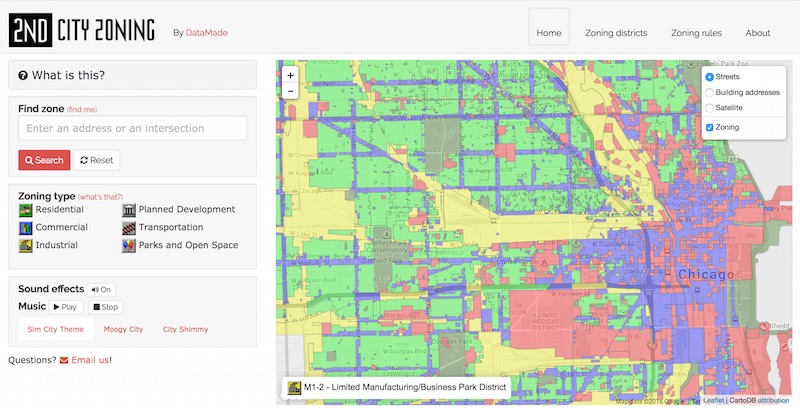
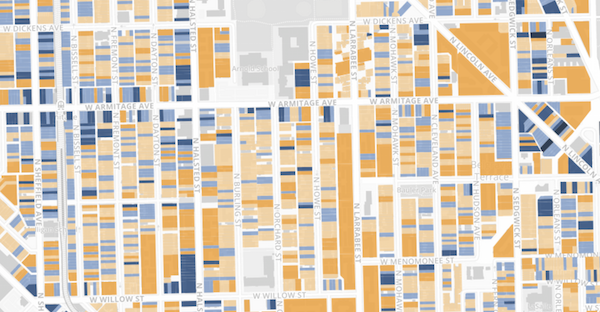
Pro bono
An interactive map that lets you find out how your building is zoned and explore zoning patterns throughout the city
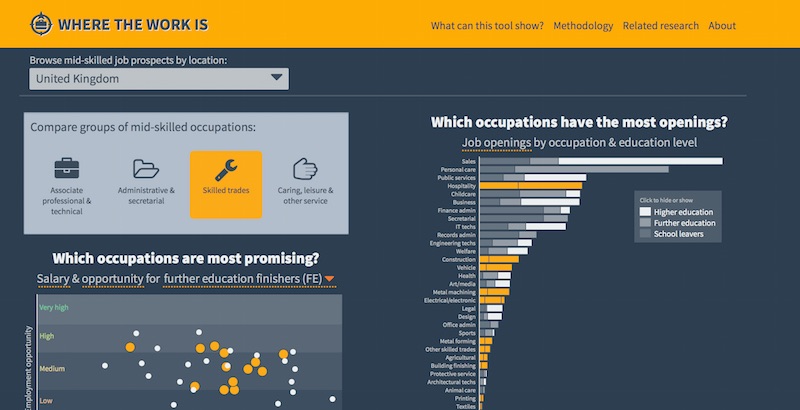
Partnership with JPMorgan Chase, IPPR, Burning Glass
An interactive visualization for exploring entry-level job dynamics for middle-skilled jobs in the United Kingdom.
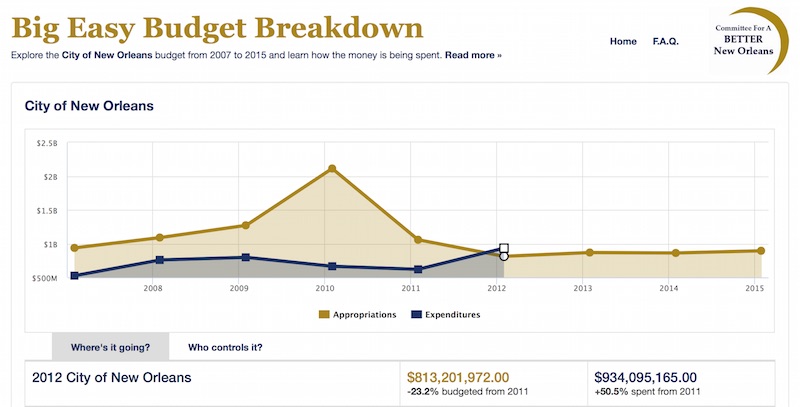
Partnership with Committee for a Better New Orleans
An explorable budget for the City of New Orleans to make government more transparent and accountable.
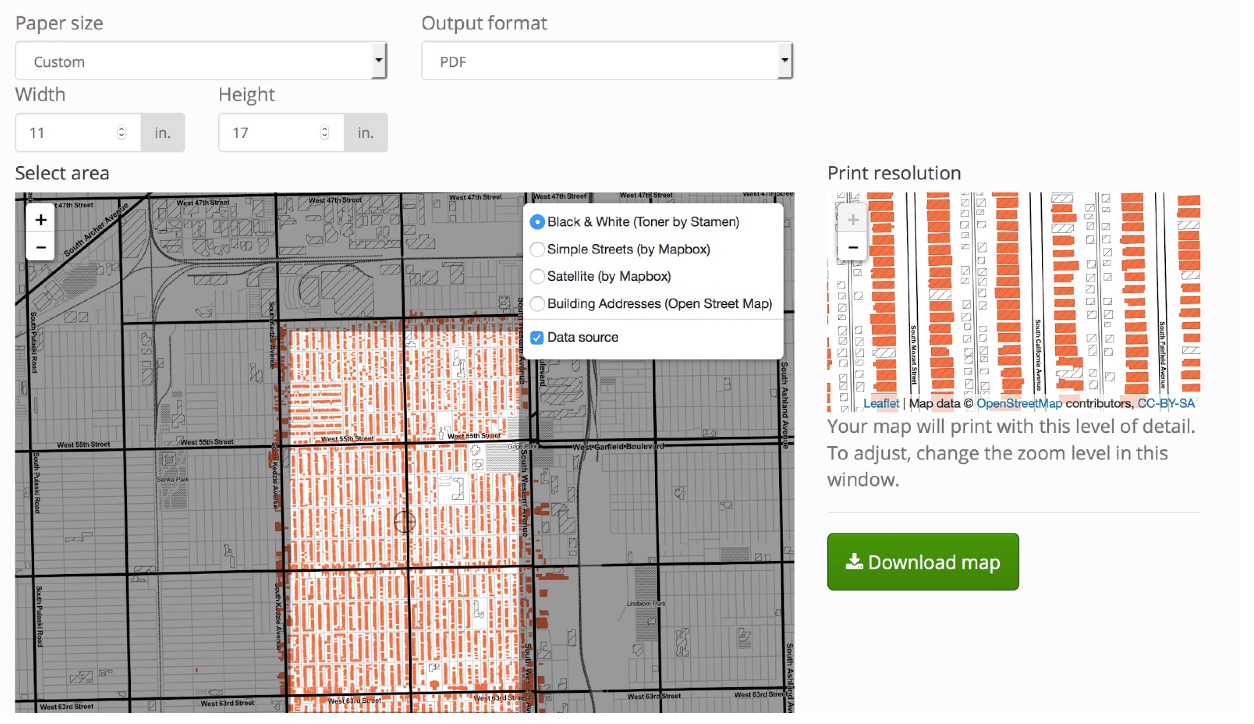
Partnership with LISC Chicago
Print high resolution data maps from the web
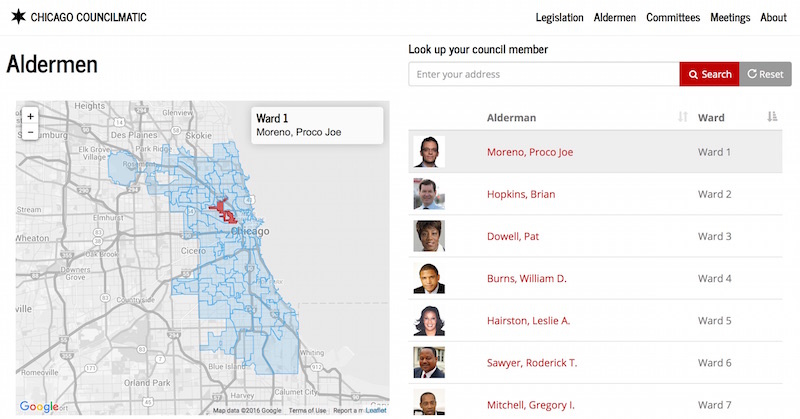
Partnership with Sunlight Foundation
An open government tool for tracking the legislation, committees, meetings and aldermen of the Chicago City Council.
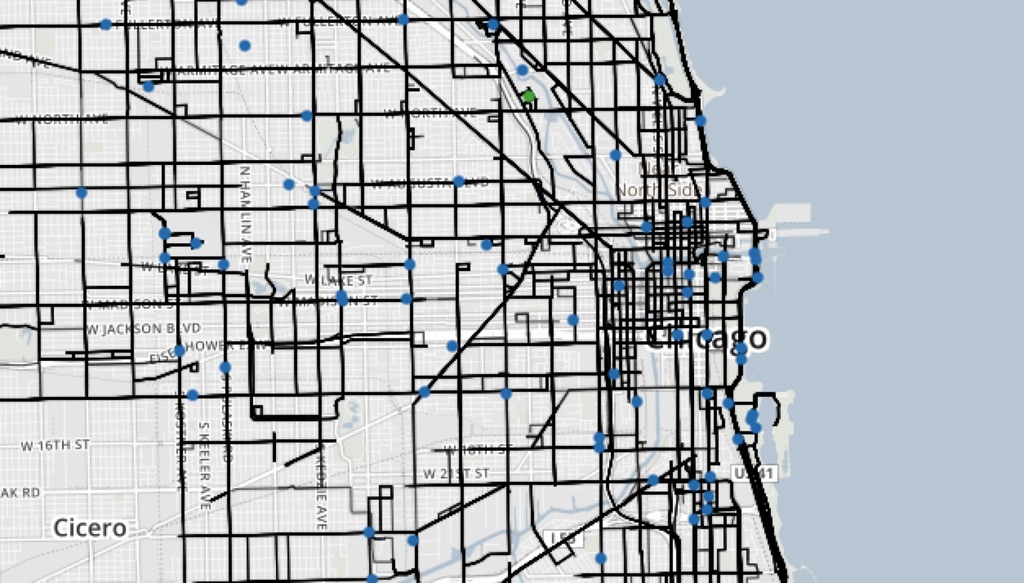
Pro bono
A civic app for tracking where Chicago snow plows have gone during a snowstorm.
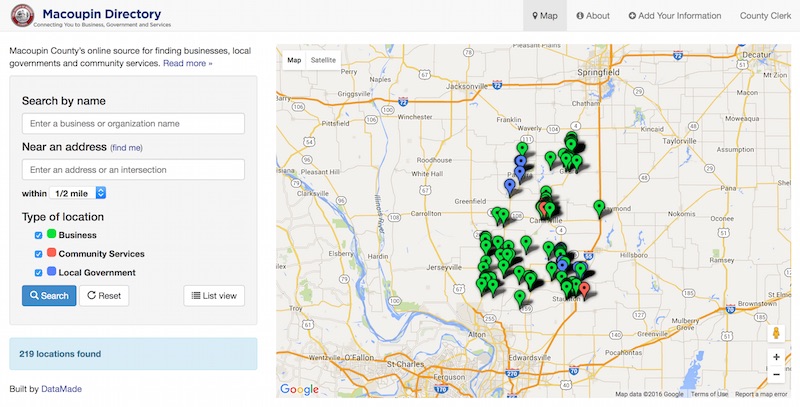
Partnership with Macoupin County, IL
A searchable map and directory for finding businesses, local governments and community services in Macoupin County, IL
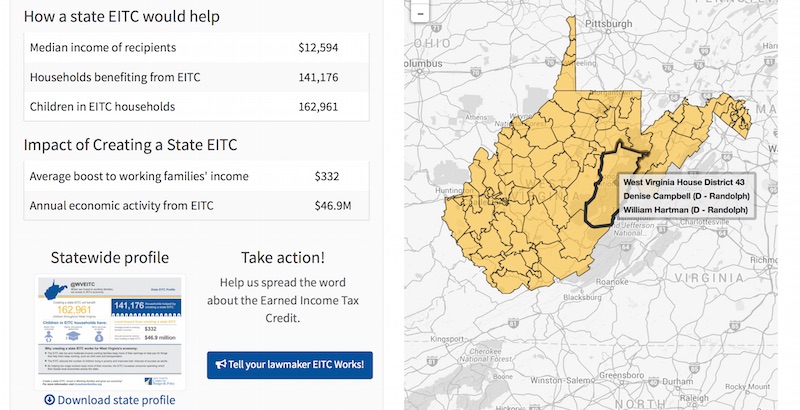
Invest in West Virginia Families
Partnership with West Virginia Center on Budget & Policy
We showed how a proposed Earned Income Tax Credit increase would affect constituents in each state district in West Virginia.
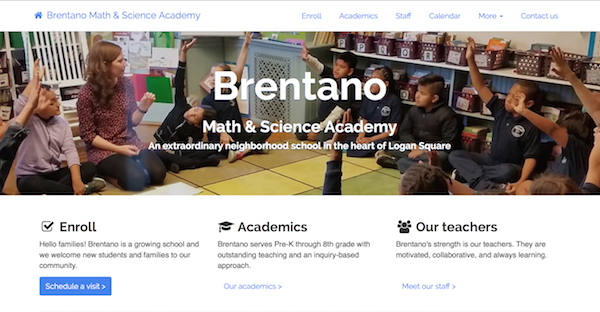
Partnership with Friends of Brentano
An open source and responsive website for a local neighborhood school, managed by the students.
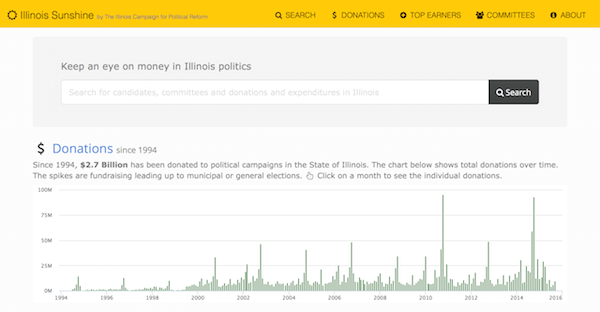
Partnership with Illinois Campaign for Political Reform
Search, browse and download over 20 years of searchable campaign finance records in Illinois.
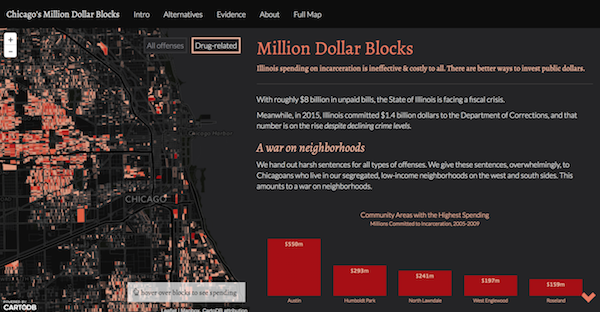
Chicago's Million Dollar Blocks
Pro bono
An interactive map showing spending on incarceration for every block in the City of Chicago.
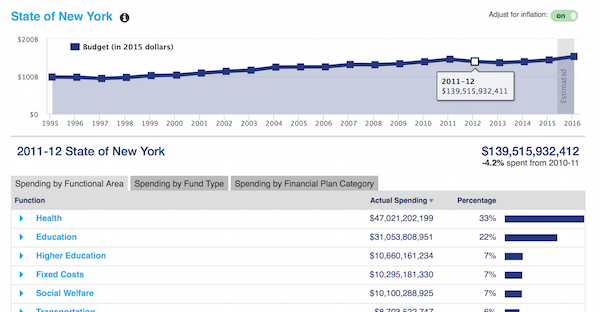
Partnership with State of New York
An explorable budget for the State of New York to make government more transparent and accountable.
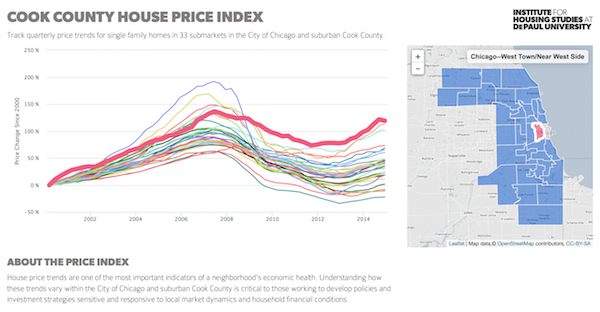
Partnership with DePaul Institute for Housing Studies
We communicated research about price trends for single-family homes in 33 submarkets in Cook County.
Partnership with Atlanta Journal Constitution
A data system to continually link information about political figures, campaign filings, contracts and lobbyist disclosures to drive investigations.
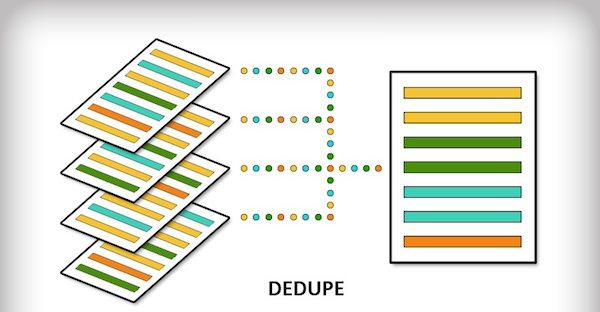
Partnership with Associated Press
A free and open source tool for journalists to easily mash up data based on shared geography.
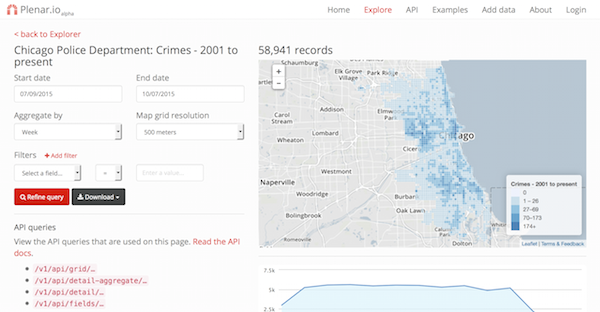
Partnership with Urban Center for Computation and Data
We worked with researchers and policy students to build a new platform to explore and build with open data through space and time.
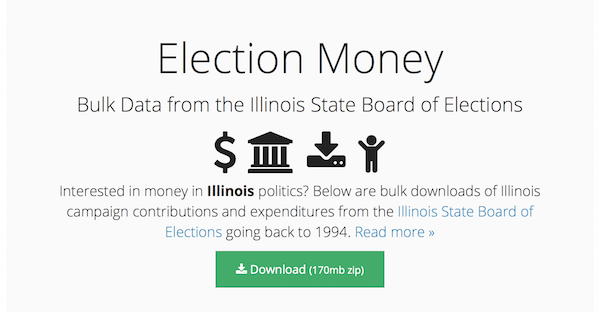
Partnership with
To empower journalists and citizens to investigate money in Illinois politics, we partnered with the Illinois Campaign for Political Reform to package up and document 20 years of campaign contributions and expenditures from the Illinois State Board of Elections.
Cook County Housing Stock Composition
Partnership with DePaul Institute for Housing Studies
We communicated research about the Chicago area housing market through an interactive map that earned national media attention.
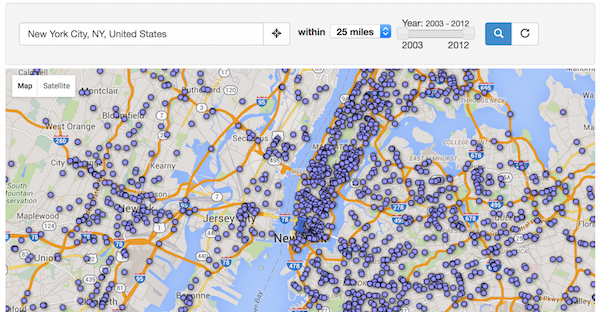
Dangerous by Design - Pedestrian Fatalities Map
Partnership with Smart Growth America
As part of Smart Growth America’s “Dangerous by Design” 2014 report on urban planning and pedestrian safety, we built an interactive map to search pedestrian fatalities in the US going back to 2003.
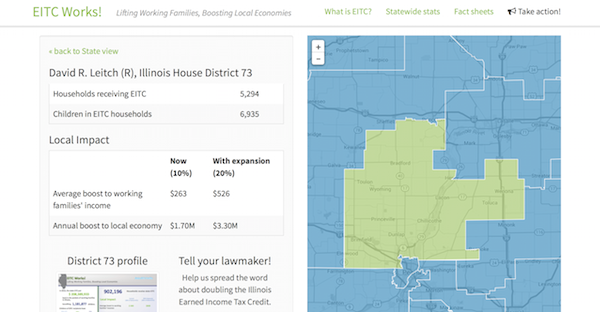
Partnership with Voices for Illinois Children
We showed how a proposed Earned Income Tax Credit increase would affect constituents in each state district.
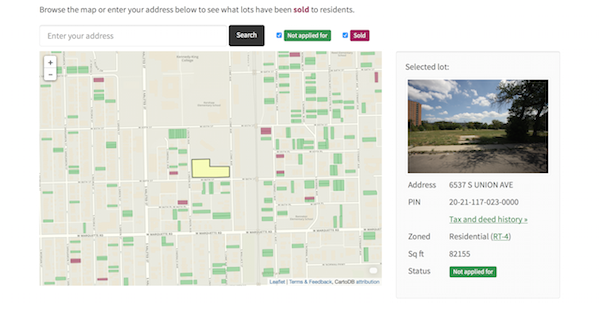
Partnership with LISC Chicago
We worked with the City of Chicago and neighborhood groups to improve and scale up a program for selling land to residents.
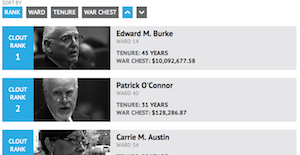
Partnership with Chicago Sun-Times
To quantify the power, or ‘clout’, in Chicago City Council, we partnered with the Chicago Sun-Times to model to rank the political influence for Chicago’s 50 Aldermen.
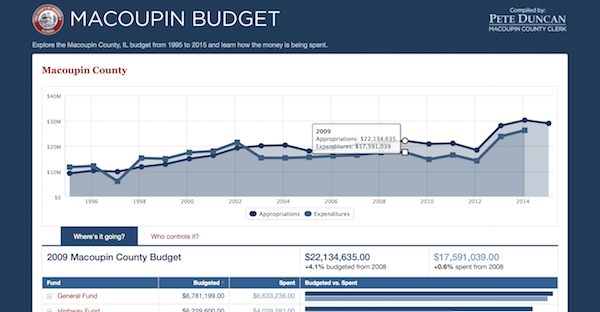
Partnership with Macoupin County, IL
An explorable County budget for Macoupin County, IL to make local goverment more transparent and accountable.
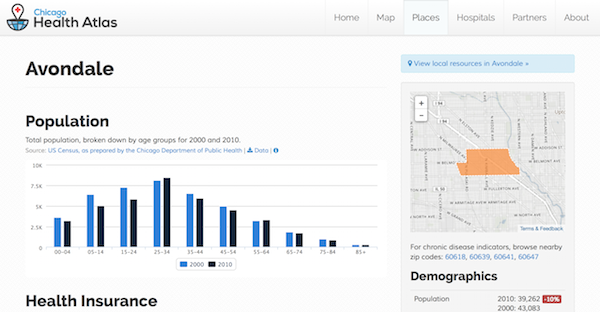
Partnership with Smart Chicago Collaborative
We worked with the Smart Chicago Collaborative, Chicago Department of Health and Human Services, CHITREC and others to create the first version of the Chicago Health Atlas, a visual and comprehensive health data explorer for every neighborhood and zip code in Chicago.
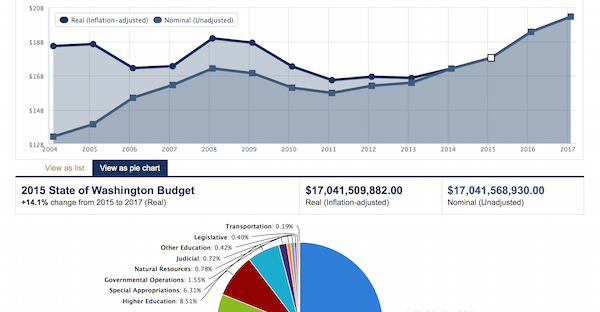
Partnership with Economic Opportunity Institute
We helped the Economic Opportunity Institute, a policy and advocacy group in Washington State, customize and launch an explorable State budget visualization.
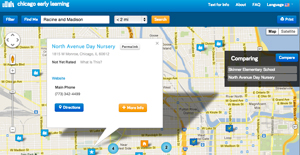
Partnership with Smart Chicago Collaborative
Tool for finding and comparing preschools, head start and other early childhood education programs.
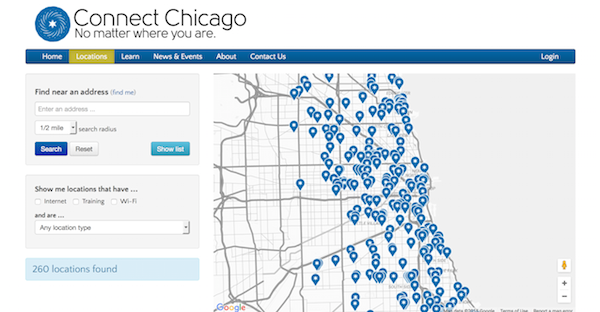
Partnership with Smart Chicago Collaborative
To help bridge the digital skills gap in Chicago, we built a system with the Smart Chicago Collaborative for searching and managing a directory of free computer labs in the city.