Illinois Wastewater Surveillance System
Partnership with Discovery Partners Institute and Illinois Department of Public Health
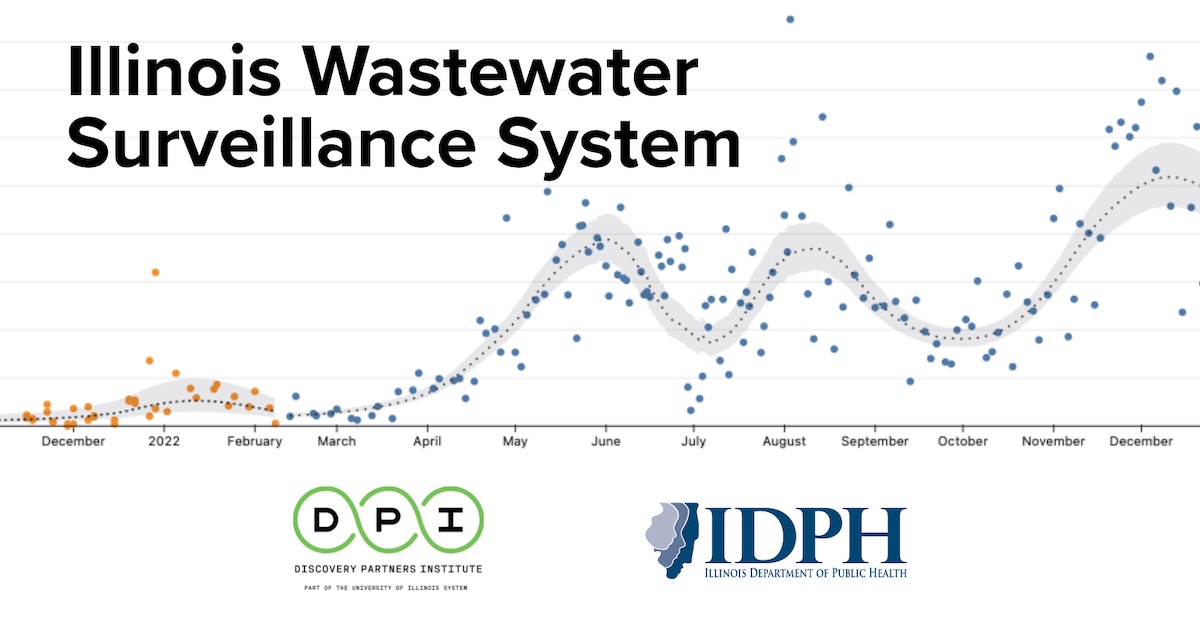
Provides series of COVID-19 measurements from wastewater for 75 sites across the state of Illinois.
More about this project
Early in the COVID-19 pandemic, the Discovery Partners Institute (DPI), University of Illinois Chicago (UIC), Northwestern University and Argonne National Laboratory formed a science team to detect the presence of coronavirus in wastewater.
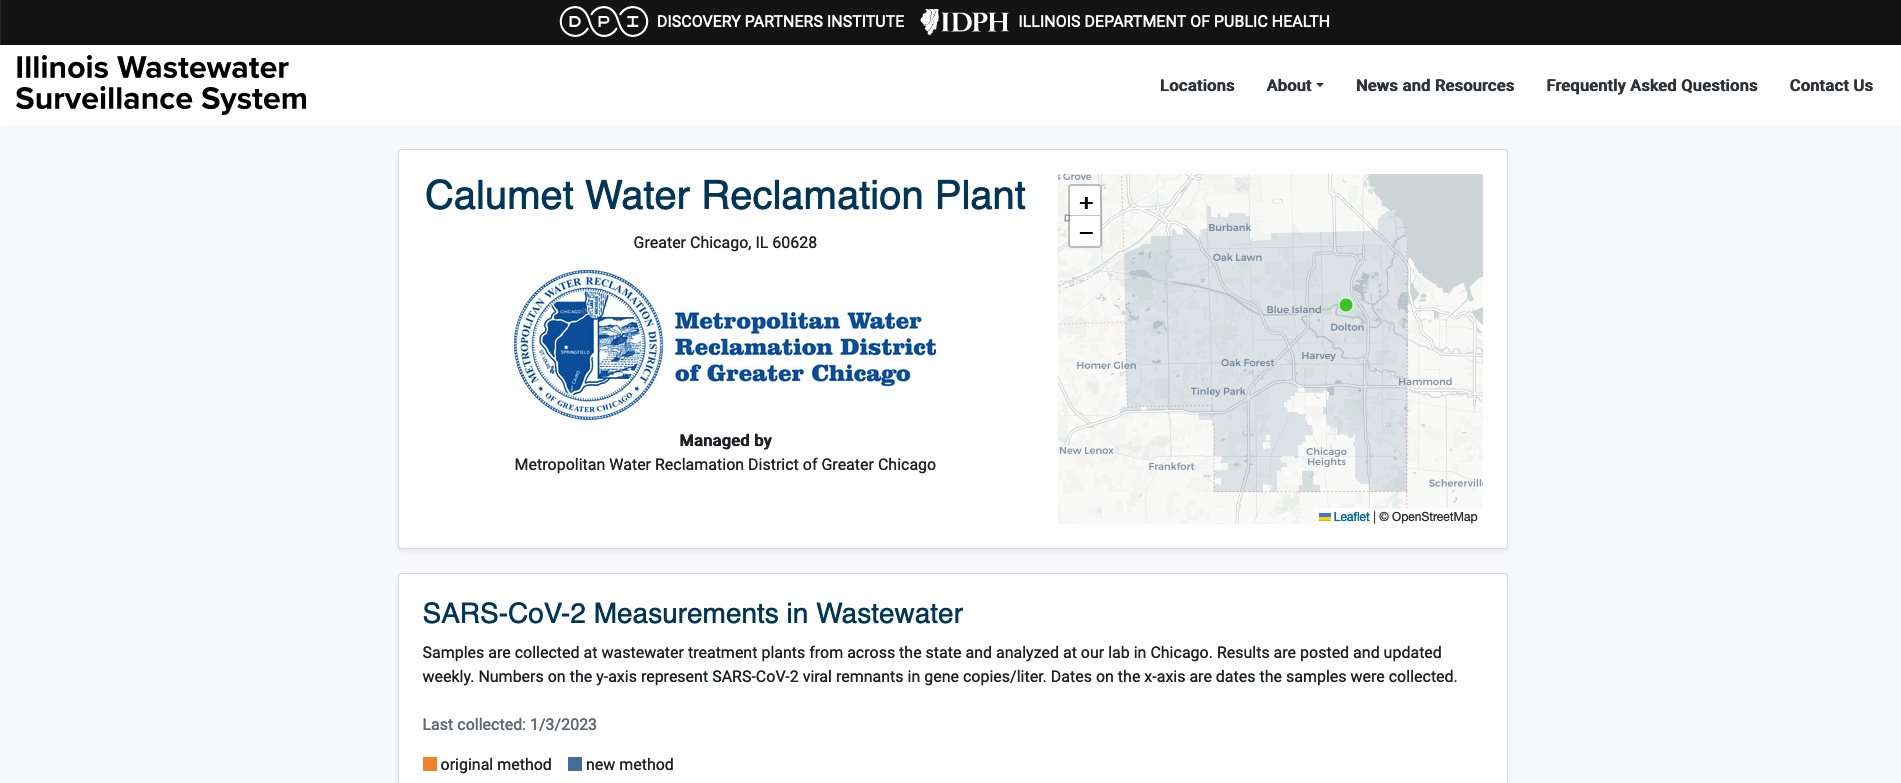
Funded initially by the Walder Foundation, and later by the Illinois and Chicago Departments of Public Health and the Centers for Disease Control and Prevention, the DPI team gathers sewage samples from treatment plants as well as directly from sewers in Chicago neighborhoods, and key facilities such as O’Hare International Airport. The contents are screened for the virus at a high-throughput lab built by UIC; Argonne then sequences the genetic material to provide data on virus variants. Northwestern heads efforts to enhance and customize data analytics for Illinois public health needs while DPI leads program management and logistics.
Weekly findings are shared with both the Illinois and Chicago Departments of Public Health to help both agencies track COVID-19’s spread and guide public health policies.
DPI and its partners are collecting samples from over 75 locations, covering the output of more than 8 million Illinoisans. To date, thousands of samples have been analyzed and sequenced. Total funding, largely from the city and state public health departments, comes to more than $17 million.
DataMade built the public dashboard for presenting and sharing wastewater monitoring data in Illinois for the Illinois Wastewater Surveillance System. The system includes an automated data import system and calculates a trendline for all 75 monitoring locations.
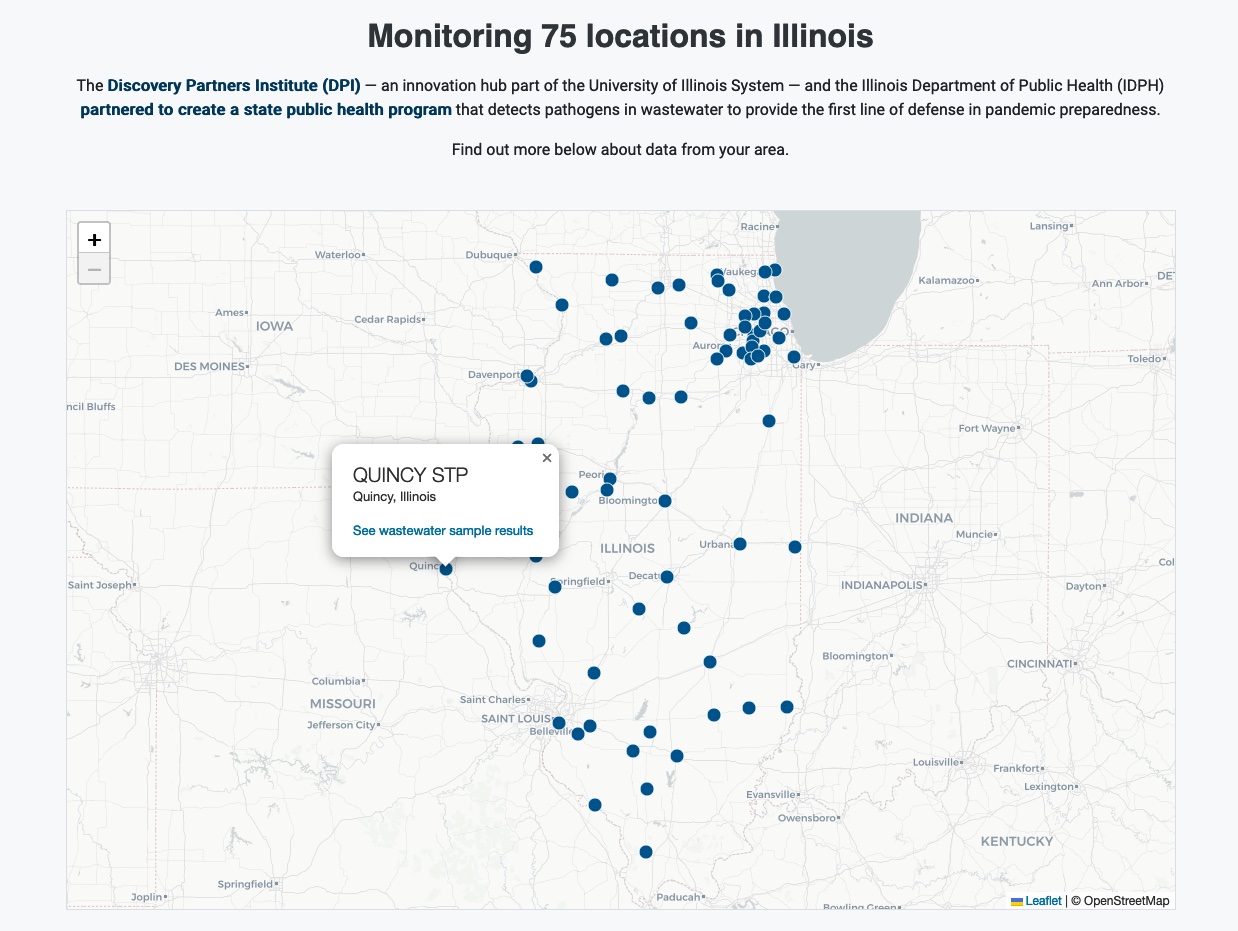
View a map of all 75 monitoring locations in Illinois
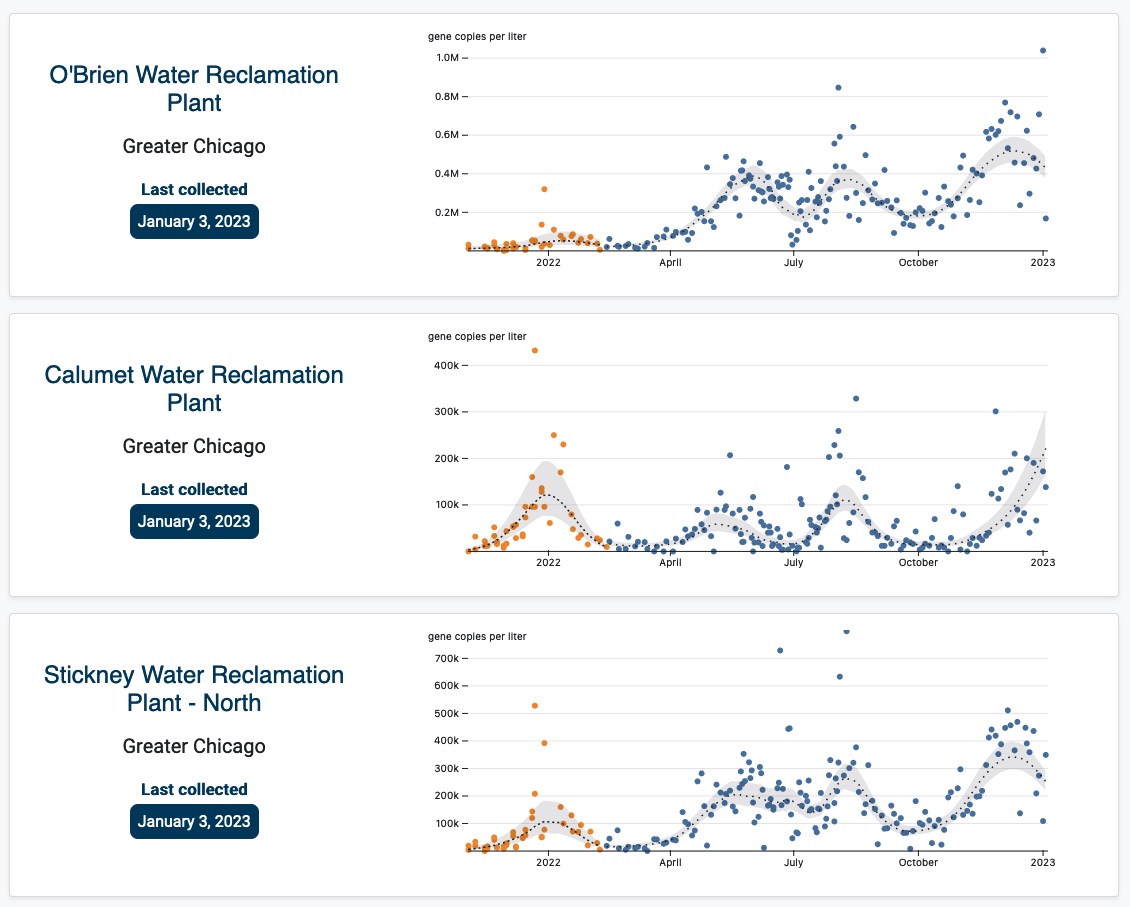
Each monitoring location shows a Loess regression to help fit a smooth curve through sampling points
Press
- A New Tool is Providing Solid Clues to COVID-19’s Resurgence - WTTW | May 31, 2023
- Discovery Partners Institute receives $2.36 million disease-control contract from Chicago Department of Public Health - Discovery Partners Institute | Feb 21, 2023
- How Much COVID-19 Is in Your Wastewater? New Online Tracker Shares Illinois Data With Public - WTTW | Jan. 10, 2023
- New website tracks COVID-19 in wastewater across 75 Illinois treatment plants - Chicago Tribune | Jan. 10, 2023
- New website tracks and shares COVID-19 levels in Illinois wastewater to help residents ‘make informed decisions’ - Chicago Sun-Times | Jan. 10, 2023
- The Discovery Partners Institute and the Illinois Department of Public Health launch an online COVID-19 tracker - Discovery Partners Institute | Jan. 10, 2023