Budget Breakdown
Empower your audience to browse and compare budgets in an interactive visualization.
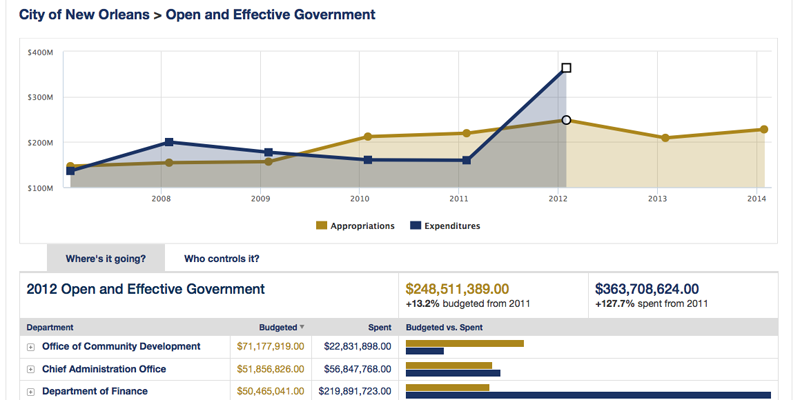
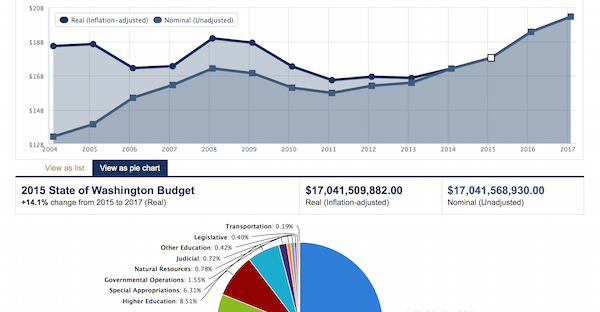
Compare budgets year over year
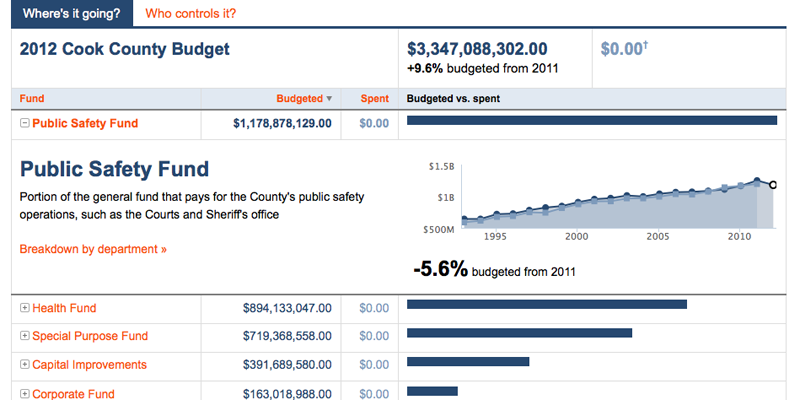
Dive in to each fund or department
Product features
- visualize any government or organization’s budget
- clean, easy to use interface
- tablet and mobile friendly
- dive in to detailed view for every department or agency
- display budget history going back multiple years or decades
- shareable links to every view
- inflation adjustment toggle
- powered by any spreadsheet, Google Doc or API
Custom deployments
DataMade can customize and deploy Budget Breakdown for your organization or government. Customizations include:
- data collection and vetting
- modifications to best display your budget
- matching your website branding, styles and colors
- integration with your website
- maintenance and data updates
- hosting
Budget Breakdown is based on Look at Cook, an Open City app built by Derek Eder and Nick Rougeux in partnership with Cook County Commissioner John Fritchey.
Deployments
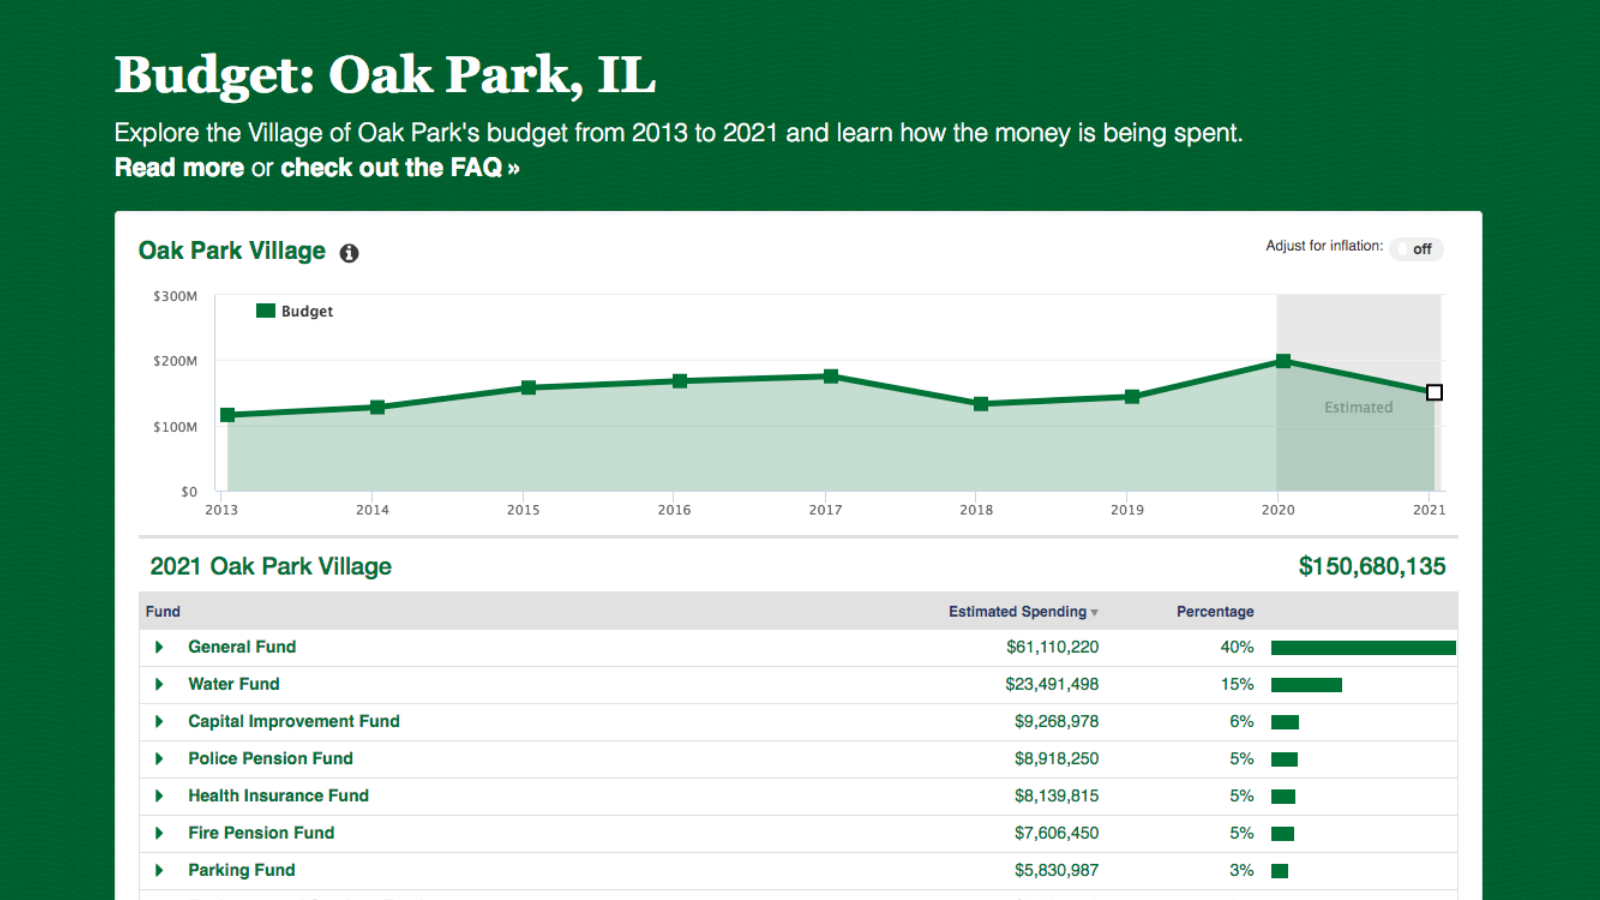
Budget: Oak Park
Client: Pro Bono
An explorable budget for the Village of Oak Park to make government more transparent and accountable.
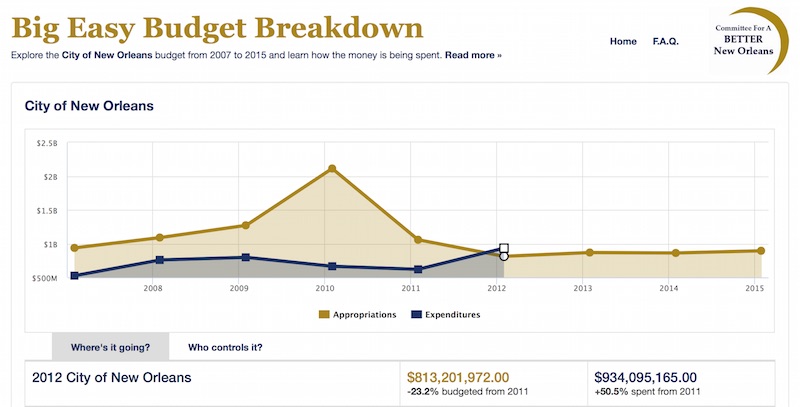
Big Easy Budget
Client: Committee for a Better New Orleans
An explorable budget for the City of New Orleans to make government more transparent and accountable.
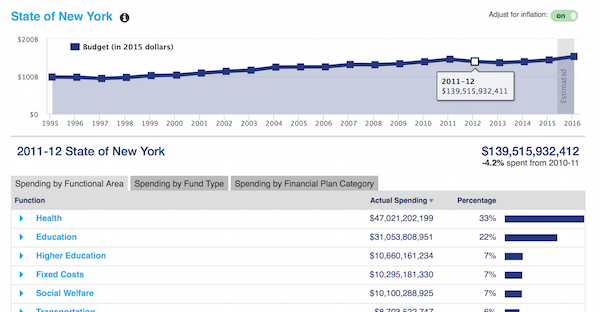
New York Open Budget
Client: State of New York
An explorable budget for the State of New York to make government more transparent and accountable.
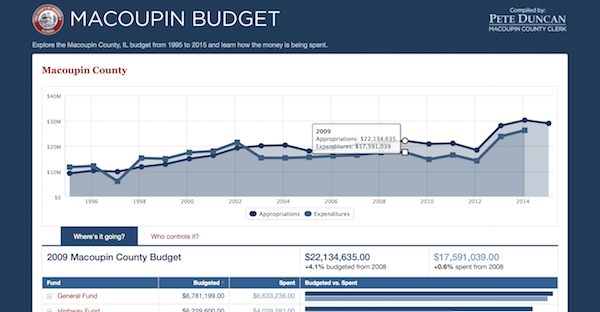
Macoupin Budget
Client: Macoupin County, IL
An explorable County budget for Macoupin County, IL to make local goverment more transparent and accountable.
State of Washington Budget
Client: Economic Opportunity Institute
We helped the Economic Opportunity Institute, a policy and advocacy group in Washington State, customize and launch an explorable State budget visualization.
