Living With Lead
Partnership with City Bureau
Liberation and statistical treatment of data on lead in Chicago’s schools and parks from more than 500 PDFs.
Read Hannah Cushman’s blog post about this project, Get the lead (and the word) out with City Bureau.
More about this project
In the wake of an ongoing water crisis in Flint, Michigan, Chicago’s school and parks districts tested the water fountains and their other water fixtures. Both agencies posted their results in PDFs, making checks of individual locations simple enough but system-wide analysis difficult. For South Side news lab City Bureau to take a wider look, we extracted the data and compile them into a standard format for analysis – all on tight deadline.
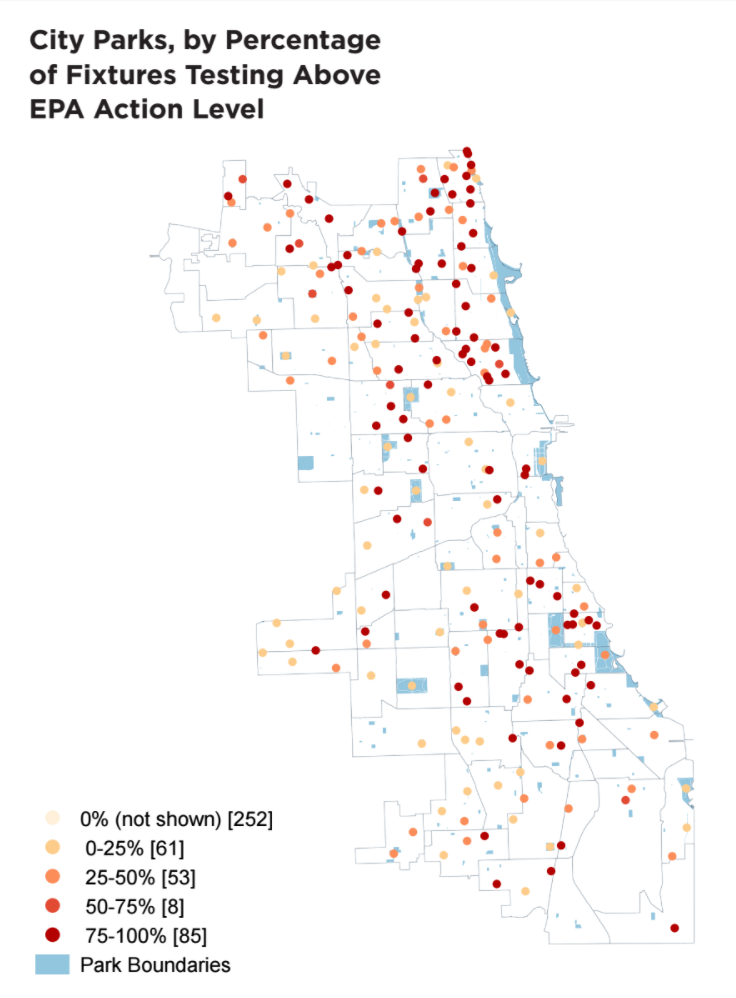
Lead measured in Chicago parks by Eric Sherman
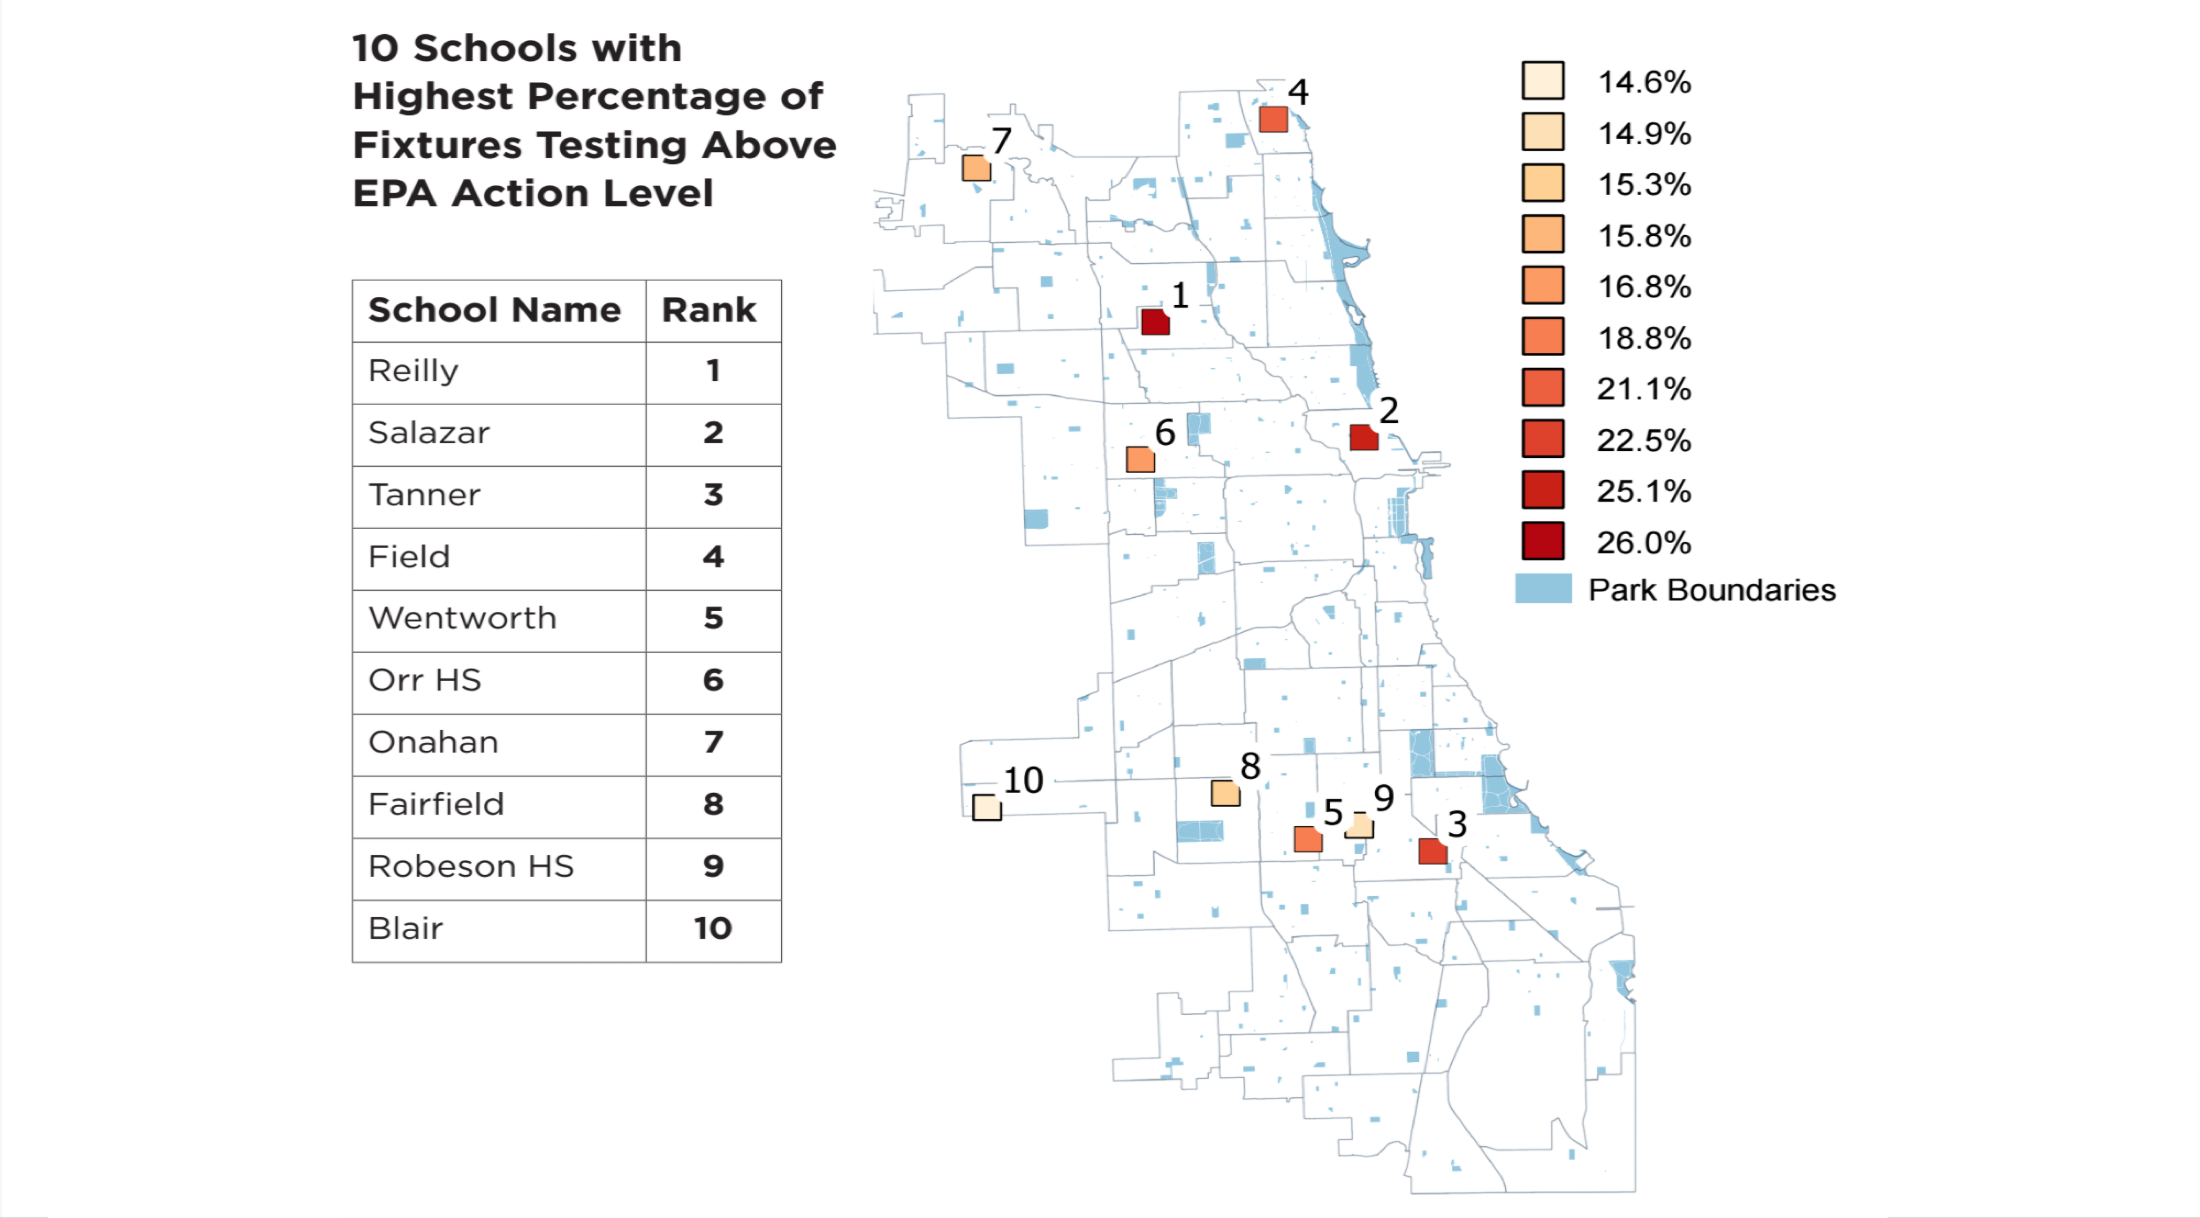
The school district posted its results in 516 separate PDFs, one for each school, while parks results came in a single, 87-page PDF. We programmatically downloaded the files then converted them back into spreadsheets using a tremendous tool called Tabula. This conversion is fragile, so we also wrote a test suite to ensure we extracted the data correctly. Even then, further cleaning was required. Once we’d wrangled the data, we calculated the proportion of fixtures in each school or park that exceeded the EPA “action level” of 15 parts per billion.
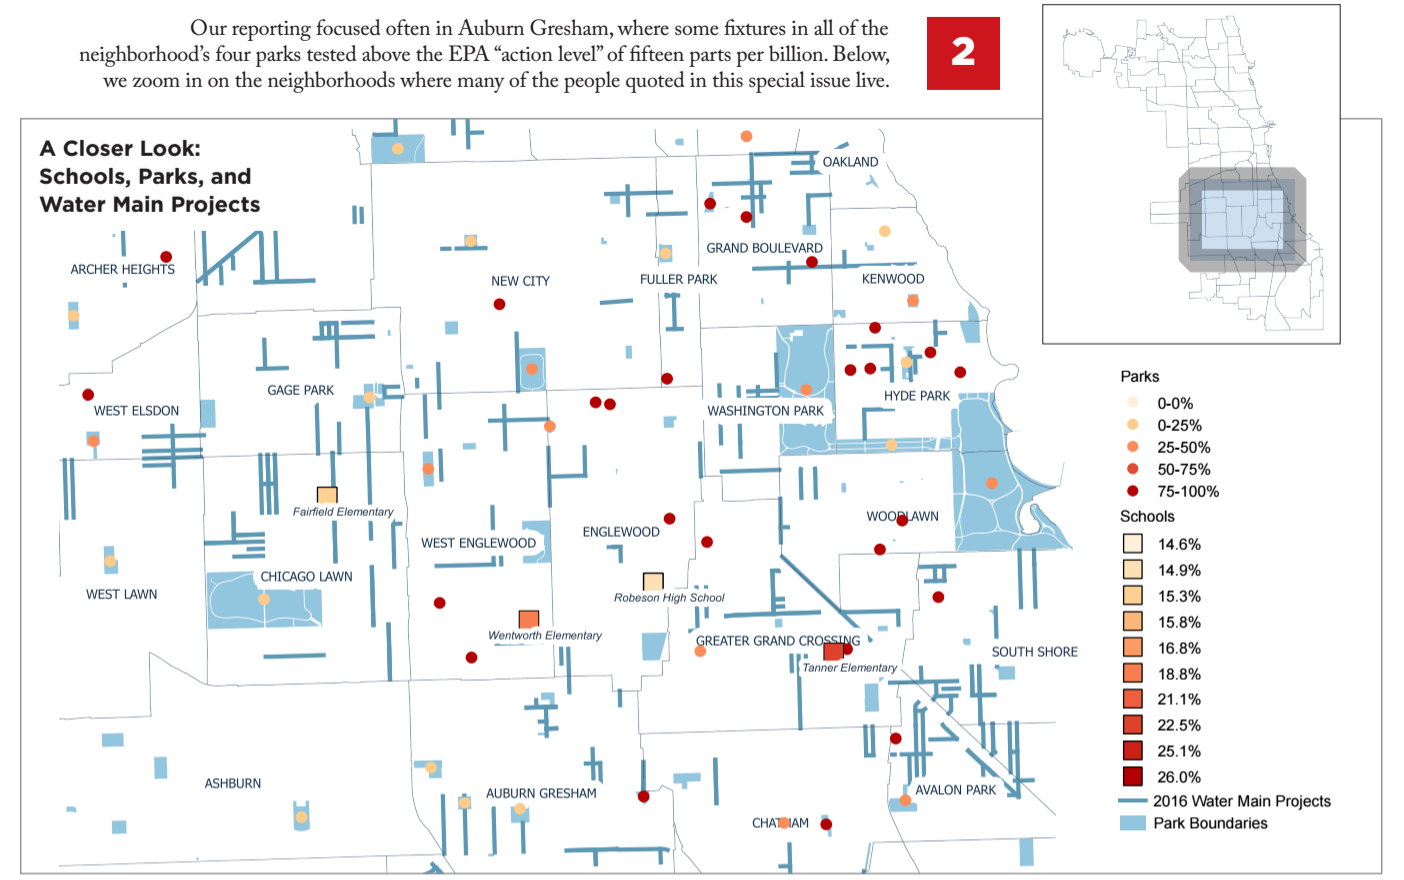
Water main projects in Chicago's Auburn-Gresham neighborhood by Eric Sherman
In addition to lead results from schools and parks, City Bureau received a list of all repairs and installations to the city’s water mains scheduled to occur in 2016. Each entry included the name of the project, a start date and a text description of where the work would be conducted, i.e. “From 475’ WEST OF S BUFFALO AVE To S AVENUE H”. In order make a map, each project needed to be geocoded. We were able to source official geospatial data for projects occurring prior to April 2016 and trained City Bureau staff to trace the paths of the remaining 210 projects using geojson.io and compile them in a Google spreadsheet. We joined our data with City Bureau’s for a complete map of 2016 projects.
The results of our city-wide analysis complemented City Bureau’s community reporting and led to a series of maps revealing lead the city-wide extent of lead problems. The full report appeared in a special issue of South Side Weekly.