The Power of Open Data
In November, we got an e-mail from Triway International Group asking DataMade to share our open data work and what’s been going on with the Chicago Open Government community with 17 delegates from the National Bureau of Statistics of the People’s Republic of China.
Published January 14, 2014
In November, we got an e-mail from Triway International Group asking DataMade to share our open data work and what’s been going on with the Chicago Open Government community with 17 delegates from the National Bureau of Statistics of the People’s Republic of China.
We had never hosted an international delegation before, let alone one of this size, but decided to sieze the opportunity to share the possibilities and power of open data with this distinguished group.
Knowing that DataMade was just part of a much larger Chicago story, we asked Tom Schenk, Director of Analytics for the City of Chicago and Nick Mader, Senior Researcher at Chapin Hall for help sharing Chicago’s story.
 Forest Gregg, Derek Eder, Nick Mader, Tom Schenk, Matt Gee and the National Bureau of Statistics of the People’s Republic of China delegation
Finding the right example
Even with perspectives from inside government (Tom), the research community (Nick) and the volunteer and private sector (DataMade), it was a challenge to articulate years of work from a diverse community through one translator in the course of two hours.
We found that the best way to share the power and success of open data was by telling the story of one dataset: Crimes - 2001 to present. This dataset, released in the fall of 2011, contains the time, location, type and case number for every crime reported to the Chicago Police Department since 2001. It contains over 5 million rows.
To illustrate just how powerful one dataset can be, we walked the delegation through several different, independently created projects, that all use this crime dataset.
Crime in Chicago by Open City
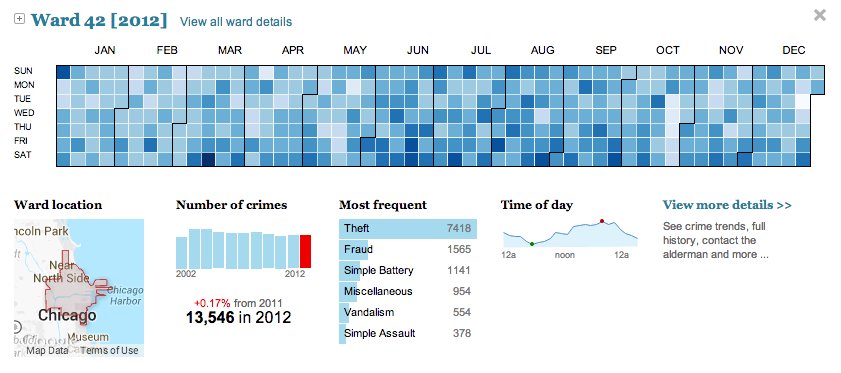
This website, launched in July of 2012 by Open City, allows you to view crime data for each of Chicago’s 50 wards for each year going back to 2002. When browsing an individual ward, a heatmap shows the number of crimes that were reported each day of the year. Additionally statistics are shown for total crime per year, most frequent crime types and time of day.
As one of the first apps created to use this data, it gave citizens an opportunity to easily view historical crime trends in their ward for the first time. It was also developed as open source software so others could contribute to and learn from this work.
Crime in Chicago by The Chicago Tribune
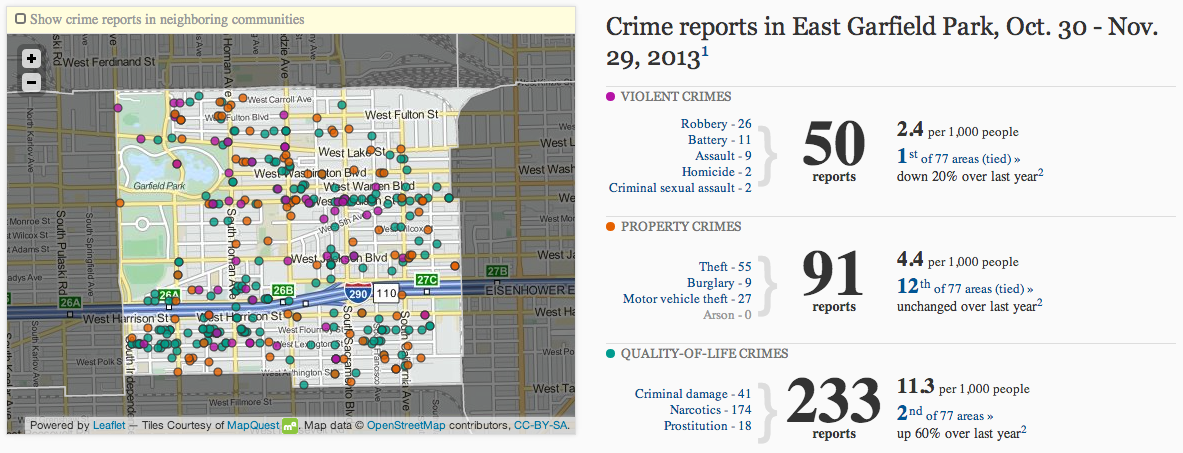 Not long after Open City launched their crime app, The Chicago Tribune News Apps team launched their own crime site with a different take on the data. They decided to organize by community areas (Census-defined areas that are kind of neighborhoody) and classified every crime in to one of three buckets: violent, property and quality of life.
These classifications, along with the community areas allow journalists at the Chicago Tribune to add a powerful data context to their articles by linking to this app.
Chicago Health Atlas by The Smart Chicago Collaborative
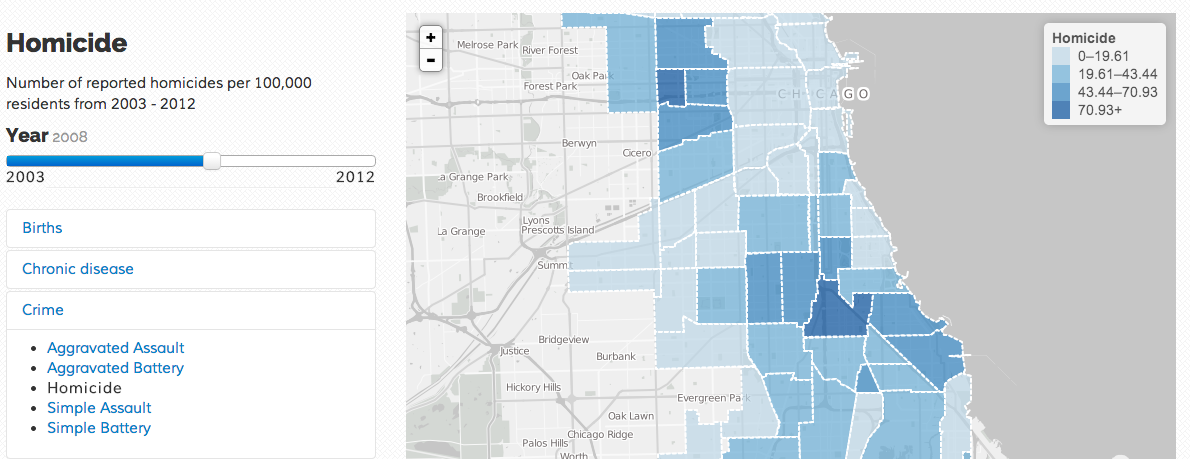 The Chicago Health Atlas, built by the Smart Chicago Collaborative, is a place where you can view citywide information about health trends and take action near you to improve your own health.
In addition to statistics on birth rates, chronic diseases like cancer and diabetes, and causes of death, the website displays homicide, assault and battery rates for each area of Chicago based on the crime dataset. Showing these rates gives visitors a better sense of the health implications of crime across the city and puts crime in a new context that had not been explored on a public website before.
Chapin Hall Collaborative for Youth Development Programs
Chapin Hall is currently working with non-profits and public agencies to measure how out-of-school programs impact youth development. This is a difficult problem because the kids that participate in these programs are not the same as kids who don’t. They differ in schools, family poverty, and neighborhood influences. These differences can also affect youth development, and so it can be hard to isolate the impact due to the programs.
If there are good measures for all the other things that can affect youth development, then we can get a better sense of the true impact of the out-of-school programs. An important factor is the crime in the local neighborhood. Because many of the programs target at-risk youth, they tend to live in more violent neighborhoods. The below chart is for a typical program:
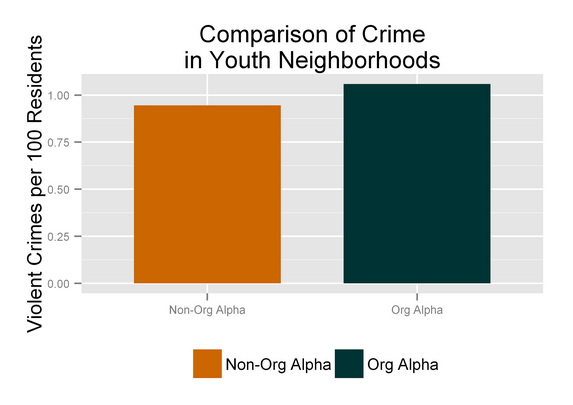
By controlling for crime and other child characteristics, a good estimate can be made on the impact of programs on improving youth math scores, as compared to a control group of youth not enrolled in programming. The black vertical line is the statistical confidence interval–i.e., the “plus/minus” region of where the impact plausibly lies.
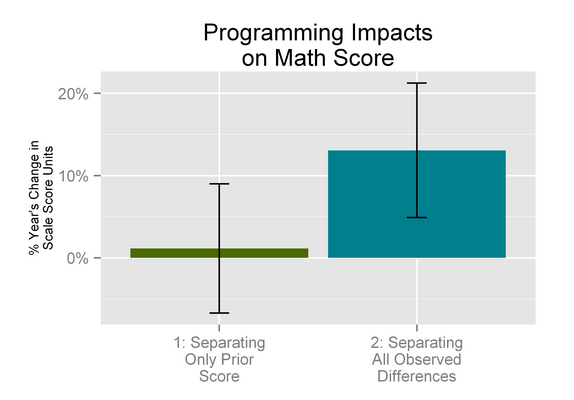
The estimate on the left is generated from a statistical model that only takes into account how youth differ in their prior-year’s test scores. That analysis makes it look as though the program has no discernible impact. The estimate on the right comes from a statistical model that accounts for many more factors including: youth’s rate of school attendance, whether they receive free- or reduced-price lunch, their special education and learning disability status–and characteristics of the neighborhood they grow up in, including violent crimes. In that rich analysis, it’s clear that the program is having an impact - the youth that they serve catch up by 10% of a year’s worth of learning in math in each school year.
In this type of work, having open data for information like neighborhood crime helps form better conclusions about what types of programs are meaningfully reaching and impacting youth outcomes.
And the data is free?
 Nick Mader, Derek Eder, Tom Schenk and Forest Gregg with their gifts from the delegation
One question that we kept getting from the delegation when talking about open data was: “and the data is free?”
To many, data is a commodity that you pay for. A common line of thinking is if something has value, as open government data certainly does, if you can sell it, you should.
However, government is in a different market position. Given the cost of technical resources and the challenges of procurement, by releasing open data, governments stand to benefit substantially from others using their data to innovate and use it in ways that had never been considered before.
And, in fact, that’s exactly what has happened with this crime dataset. When it was released, no one would have expected it to be used for data driven journalism, be compared against health statistics, or used to determine the efficacy of after school programs.
But in the case of Chicago, that’s exactly what happened, and it’s because the data was available, and it was free.