Mapping Twenty Years Of CPS Closures During The DataMade Mentorship
Jay Yugen worked with twenty years of Chicago Public School data to begin creating choropleth maps illustrating public school closures, in the context of their demographics and that of their surrounding neighborhoods.
 Jay Yugen

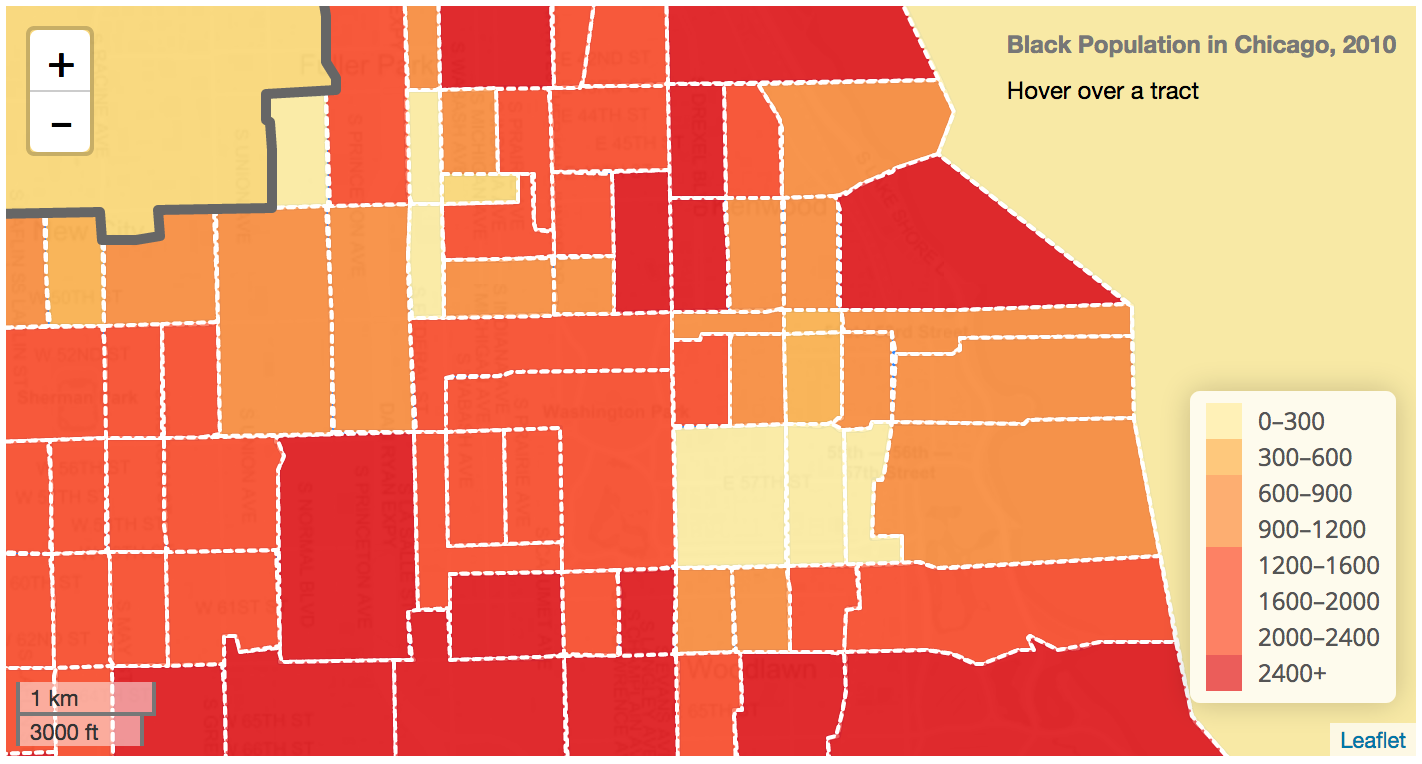
The choropleth map of the 2010 Black population in Chicago sheds light on the demographics of areas where school have been shut down.
We’re proud to publish below a reflection from one of the participants in the first cycle of the DataMade Mentorship program. We plan to run this program again in the future—if you’d like to be notified when applications reopen, sign up for our mailing list.
Allow me to reintroduce myself. My name is Jay, Y to the ugen (please use Beyoncé’s husbands voice when you read that). Jay Yugen, Phd that is. You can call me Jay, Dr. Yugen, or Awesome. My pronouns are she, her, hers.
I am naturally inquisitive and a researcher at heart. I enjoy exploring potential solutions to societal and organizational issues. My expertise is in using mixed methods and gathering empirical data with the hope that the information may be applied to sociological issues like race, space, and education.
In my former career I was a researcher, professor, administrator, and advocate for children with disabilities. My interest in advocacy led me to co-found an organization to empower teenagers and young adults with severe disabilities to lead more independent lives. I decided to create the website and maintain its data myself, to save on cost, and I began to enjoy this aspect of the job more than my original responsibilities. I also began to help other small business owners with their websites and data management, and to help clients implement aspects of technology to pursue their passions and/or aid in their independence. It is from this perspective that I became interested in a career in coding.
To date I am working towards a full stack certification from both FreeCodeCamp and the Odin Project, and have already completed SoloLearn courses in Python. In addition to attending meetups and conferences, I have also attended various workshops like DjangoGirls.
✶ ✶ ✶ ✶
During the DataMade mentorship program I worked to create a historical view of public schooling in Chicago, using a series of interactive maps that provide the user with comprehensive data about the Chicago Public Schools from various perspectives. The website will be user friendly, and provide easily accessible information regarding the city’s 2,456 public and charter schools. My data covers over twenty years of change, and eventually could be used in various ways: initially to compare the demographics of public schools to their surrounding areas, and eventually to allow parents to compare schools and researchers to map the educational inequities in Chicago.
The mentorship program presented a wonderful opportunity to meld the two things that I hold most dear (professionally, of course): educational research and coding. And also, it provided a lovely mentor to guide me through the process of map making with QGIS and Leaflet—two technologies I wasn’t at all familiar with before the program. I additionally became way more comfortable using GitHub, the command line, and Atom.
In addition to expanding my knowledge of Python, I wanted to pursue the DataMade mentorship to connect formally and informally with other developers to be sure that I was on the right track with the way that I write code (was my code clean?) and solve problems with my code (did I need to tweak how I debug?). It was my hope that the DataMade mentorship program would provide both a connection to other developers and access to “insider knowledge”.
The program exceeded my expectations. My mentor, Jasmine Mithani, connected me to a few organizations and helped me to attend a few conferences. Most recently, I attended PearConf and watched her present. It was one of the best conferences that I’ve ever attended. I am a well seasoned conference participant, so you can believe me when I say that it was amazing.
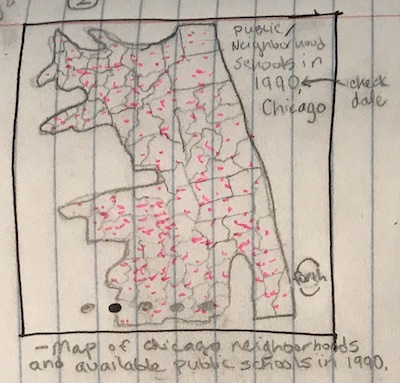
Sketching out your ideas is a great way to clarify your vision.
A challenge for me during the mentorship has been sticking to my original timeline. This experience has taught me to sketch my vision early and often. I now realize that my project was ambitious for a six week program, and that it’ll take a bit more time to complete than I had originally planned. As one example, I originally learned to create maps using an expensive program called ArcGIS, and believed Leaflet would be a no cost version. However, as I began to create my first map, I learned that many of the features that were rolled into ArcGIS—those that made the process a bit more linear—were not included with Leaflet. This led to various attempts to figure out how to attain a similar result with no additional cost. Jasmine is essential in speeding up this process by suggesting new technologies and tools. Still, factoring in not only the time required for debugging, but the required time to find new technologies and then learn how to use and include those features, was not in my original timeline. I learned that it’s important to scope each step, and amend as necessary, especially as things can become a bit complicated as the project continues. I’m going to continue to enjoy the process, and hopefully I’ll be able to provide an update to this blog post once the website is completed later this year.
Once this project is completed, I’m going to continue along my path toward becoming a full stack developer. I’ll apply to both apprenticeships and junior developer roles at companies with strong mentorship components, and continue to develop supportive networks by keeping in touch with people that I’ve met at conferences, participating in meetups, and attending events and conferences and most importantly, asking for help when I need it.
To those interested in applying to the program, I’d like to suggest that you pace yourself, and have clear goals each week. It’s probably a great idea to put pen to pad and draw your website or project idea during the first week. Or better yet, before the interview.
To all those who plan to apply, good luck!
Jay (Superhero Pose)
You can learn more about Jay and the kind of work she does at her website, which she notes is a work in progress.
