Civic Tech Done Right – Community Driven, Community Responsive, Community Friendly
Neighborhood organizers and software developers don’t ordinarily move in the same circles. But in Chicago, thanks to some tool-hungry community organizers and neighborhood-oriented software developers, a couple of computer applications have emerged that are enabling neighborhood residents to play a greater role in improving their communities. This is a story, told from the perspective of three people, of how and why those applications were developed.
Published February 08, 2016
 Taryn Roche
 Andrea Ortiz
Neighborhood organizers and software developers don’t ordinarily move in the same circles. But in Chicago, thanks to some tool-hungry community organizers and neighborhood-oriented software developers, a couple of computer applications have emerged that are enabling neighborhood residents to play a greater role in improving their communities.
This is a story, told from the perspective of three people, of how and why those applications were developed.
The beginning
Told by Derek Eder, partner at DataMade,a civic technology company that builds open source technology to help journalists, researchers, governments and advocacy organizations access and analyze public data.
Our journey with LISC started at the Chicago Police Department’s Safe Communities Hackathon in May 2013, when Patrick Barry, a LISC scribe with a keen interest in using technology to guide neighborhood development issues, met Eric van Zanten (who now works at DataMade) to discuss how to make the City of Chicago’s open data set on reported crime easier for community groups to use.
The dataset, which has the location, time, and description of 6 million crime reports over 15 years, is enormous and unwieldy. Excel crashes when you try to open a file larger than one gigabyte, so how could the average person, without access to geographic or advanced statistical software, make use of this data?
Barry, with Chicago’s community development organizations in mind, wondered if it would be possible to easily view crimes in a specific geographic area, such as on a particular block on in a particular neighborhood. After approaching several developers at the hackathon, van Zanten believed it was possible and in a few days created CrimeAround.us.
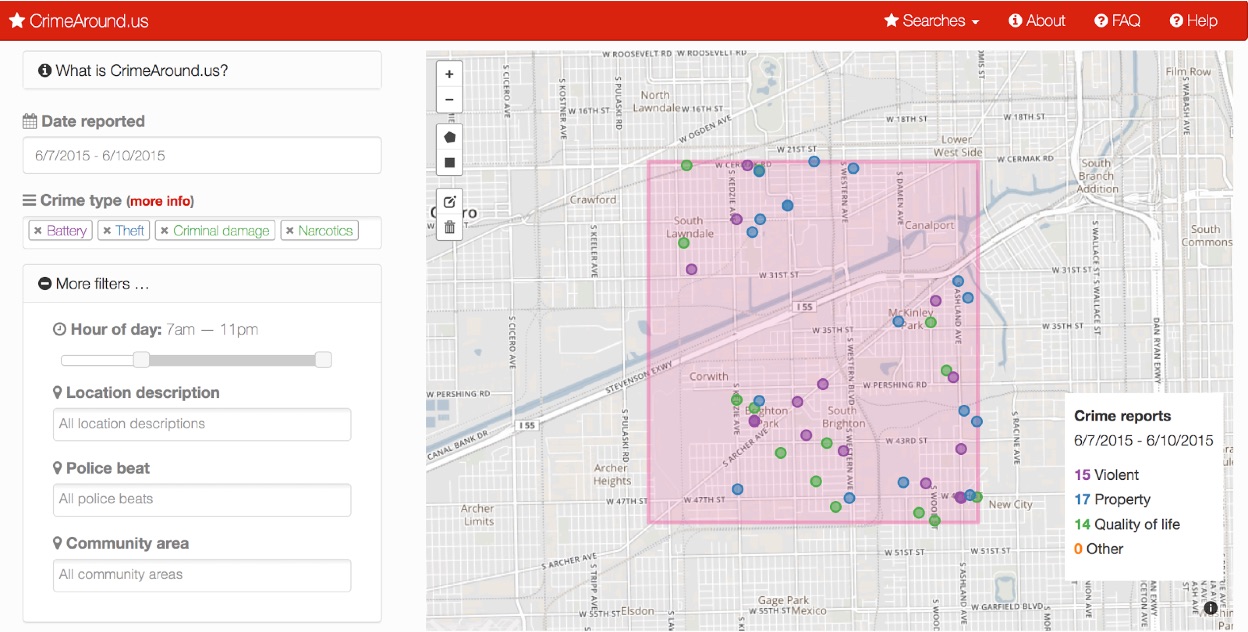
CrimeAround.us, map crime reports from the Chicago Police Department
Finally: A tool we can use!
Told by Taryn Roch, LISC Chicago’s Director of Program Assessment, who introduced DataMade to community based organizations.
LISC knew that CrimeAround.us, with its accessible interface, would be immediately useful to community organizers addressing public safety issues in their neighborhoods. Not only did the application work exactly as requested, and in a simple fashion, it also increased the likelihood that community organizers could make real use of crime data published to the database – a great resource which, because of its volume, hadn’t been useful to community-based organizations. Without the time, or the access to geospatial software, community organizers were unable to pull much value from the data on the portal.
We’d heard all the buzz about the open data movement. But since the first data sets were published, we hadn’t seen many examples of how open data or the applications built with it might benefit organizations serving Chicago’s low- and moderate-income neighborhoods. LISC sought the right opportunity to match Chicago’s tech talent and newly available data with the needs of Chicago’s neighborhoods – as defined by those neighborhoods. With a grant from the Knight Foundation, LISC implemented its Open Gov For The Rest of Us project, and contracted with DataMade to continue work on CrimeAround.us and other applications as ideas from neighborhood partners emerged.
LISC convened a group of community organizations to see a demo of crimearound.us and share their thoughts on the tool for community organizations. From their feedback, DataMade added additional functionality such as more refined searches based on times of day and types of crime. Community partners have since used the tool to map the impact of programs like safe passage and sports programs on crime trends, or to address overblown perceptions about crime on commercial corridors.
A case for data
Told by Andrea Ortez, an organizer for the Southwest Organizing Project (SWOP) in the Chicago Lawn neighborhood.
When LISC first introduced me to CrimeAround.us I was fascinated with the software’s ability to visually translate crime data quickly and easily. I work with youth and their families on the Southwest Side of Chicago and in light of the violence that often affects us, I wanted this information to be accessible to our community leaders. Seeing CrimeAround.us helped me understand how data can become a practical and helpful tool. I wanted to use CrimeAround.us not only to show reported crimes, but unreported crimes as well, which weren’t part of the underlying data and needed to be integrated outside of the application. I wanted to present the data to groups of neighborhood residents in printed form, since 12 people huddling around a computer screen wouldn’t be effective, and information we share is still typically on paper.
If it doesn’t work on paper, it doesn’t work
Derek Eder:
Printing was not a function we ever expected users to need. Turns out, printing on CrimeAround.us, as well as most web-based maps, was broken. What you saw on the screen, was not what you got on paper.
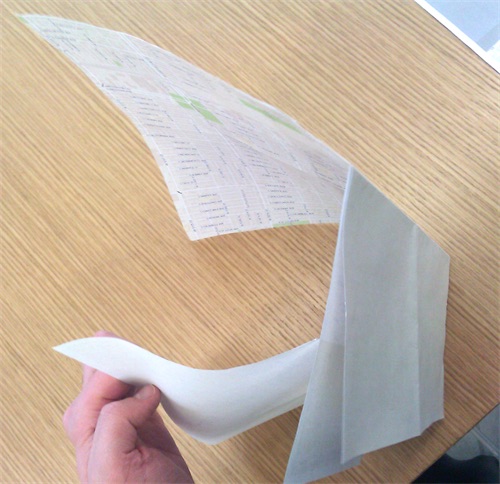
To work around it, Andrea used CrimeAround.us to stitch together a base map of streets. This is the base map she taped together after several frustrating hours:
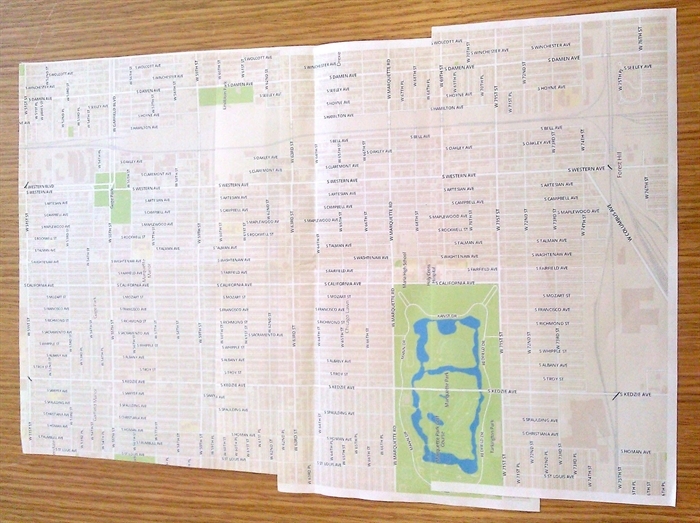
Andrea's result after several frustrating hours of printing and taping
Andrea then overlaid a transparency over that basemap and hand drew police beats with a marker. Then she overlaid a different transparency and drew dots, again by hand, on the transparency of where violent crimes happened during one period of time of day. She did the same for another time of day. Then another. Then another.
Andrea Ortez:
Initially when I tried to print from CrimeAround.us I thought SWOP’s printer or system was to blame, I didn’t think the tool itself lacked the capacity to print. I thought that taping maps together and drawing on transparencies was necessary to get what I needed. I later learned from DataMade that CrimeAround.us did not even have the capacity for printing.
Taryn Roch:
This is something our neighborhood partners do all the time – “jerry rig” existing systems to get a desired result. Creative and tenacious, community organizers sometimes assume that even the tools developed for them will not work as planned given their technology infrastructure or deficiencies within the tool itself. By connecting the application developer (in particular one dedicated to learning and improvement) to the user directly, we were able to pursue a different path that was truly responsive to Andrea’s needs.
Andrea Ortez:
I wanted the crime data to be useful to our community partners. I knew for our local schools that it was important to be able to see crime at different times of the day, before school arrival, after school dismissal, etc. The partnership with DataMade and interaction with CrimeAround.us had three outcomes:
1) We interact with crime data more frequently and have found it beneficial to an understanding of our work and our community;
2) We have been able to recognize patterns and the areas on the Southwest Side most affected by crime; and,
3) We’re able to build stronger relationships with youth, parents and residents by connecting data with their experience on the ground.
A new feature is born: printing!
Derek Eder:
After the initial meeting with Andrea, we had a new appreciation for how creative and resourceful people are – using a tool to do something that was never intended. Now that we knew how Andrea needed the tool to work, we set out to solve her problem.
Making print-quality maps is not a straightforward task. There are two main challenges:
1) Paper is at a much higher resolution than most computer screens, so images that look fine on your monitor come out pixelated or blurry.
2) There are thousands of different printers in the world, and each one has its own nuances in how they print.
To address the high resolution problem, van Zanten used a web map’s ability to zoom in and out to fetch a higher-resolution version of the area that the user selects. Once we had that, we stitched together a large image. To address the differences across printers, we placed the images into Portable Document Format (PDF) so they could be printed anywhere.
We then added that functionality to the CrimeAround.us app. Now, on any view of the map, you can click the print button in the lower left to get a high-resolution PDF of your map.
Introducing Lascaux
Derek Eder:
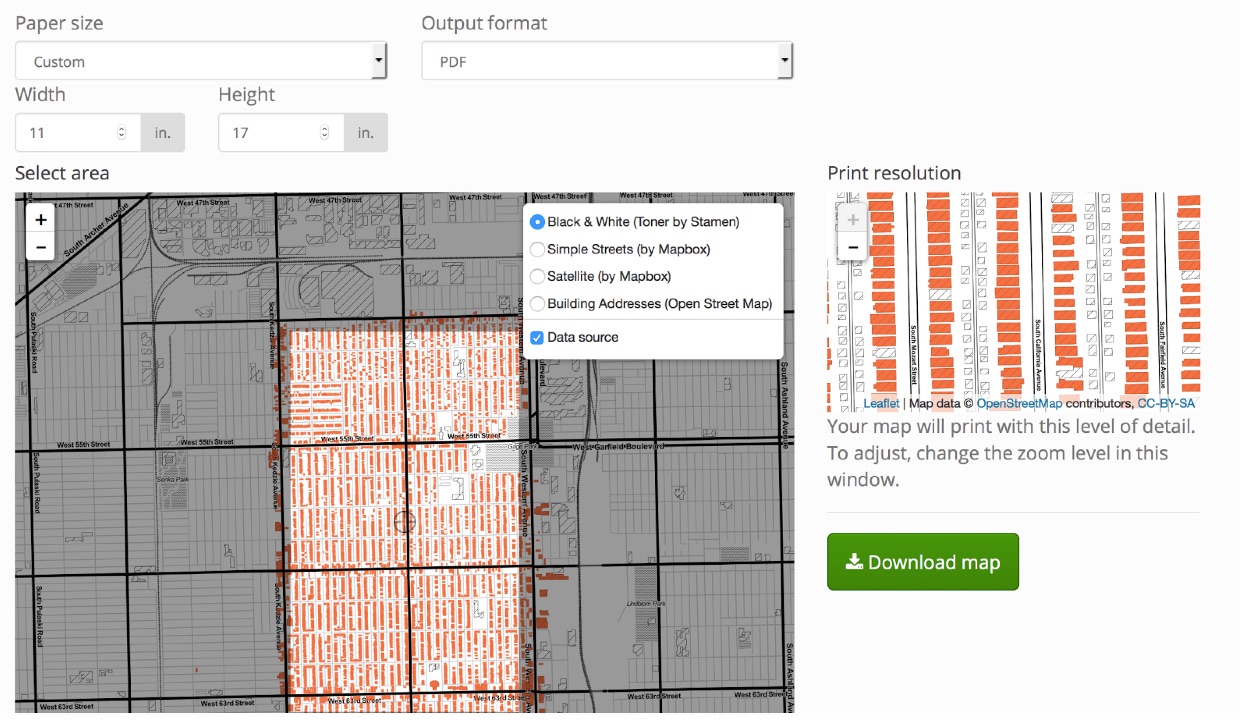
Lascaux: Print high-resolution maps from the web
Realizing that we had created something that was useful for many other mapping applications, we made this print-o-matic into its own application, calling it Lascaux, in reference to the caves of Lascaux in southwestern France, which house the first known maps created by humans.
To get started, select a paper size, output format (either image or PDF), and map style, then pan and zoom to the area you want to print. You can increase the size of the covered area by zooming out the print resolution. When you’re done click “Download map” to get your printable map.
DataMade recently used Lascaux to provide a high resolution of lots available for sale via the City of Chicago’s Large Lot Program to help community development organizations market the program in the Roseland/Pullman neighborhoods. SWOP continues to use Lascaux – most recently to print maps of vacant properties surveyed using a mobile application called Local Data.
As software developers, we spend most of our time using, communicating and building things for the web. In doing this every day, it’s easy to forget that many of the people who end up using our tools don’t interact with them the same way we do or even imagine they might.
Great tools are never created in a vacuum. To build useful tools for everyone, you have to talk to people. You have to see where they live and work. You have to build with them, not for them.
This was originally posted on the LISC Chicago website on Jan 15, 2016